 Sign up with Google
 Sign in with Zoho
Employee transportation costs rarely increase because of one major issue.
More often, the budget leaks quietly through half-empty cabs, unnecessary route extensions, idle vehicles, last-minute cancellations, repeated delays, additional vehicles and operational exceptions.
That is why Employee Transport Cost Optimization should not simply mean negotiating lower rates with transport vendors. Sustainable cost optimization comes from understanding how efficiently the entire employee transportation operation is performing.
For transport managers, the right KPIs can reveal where money is being spent efficiently, where it is being wasted and where smarter decisions can improve operations.
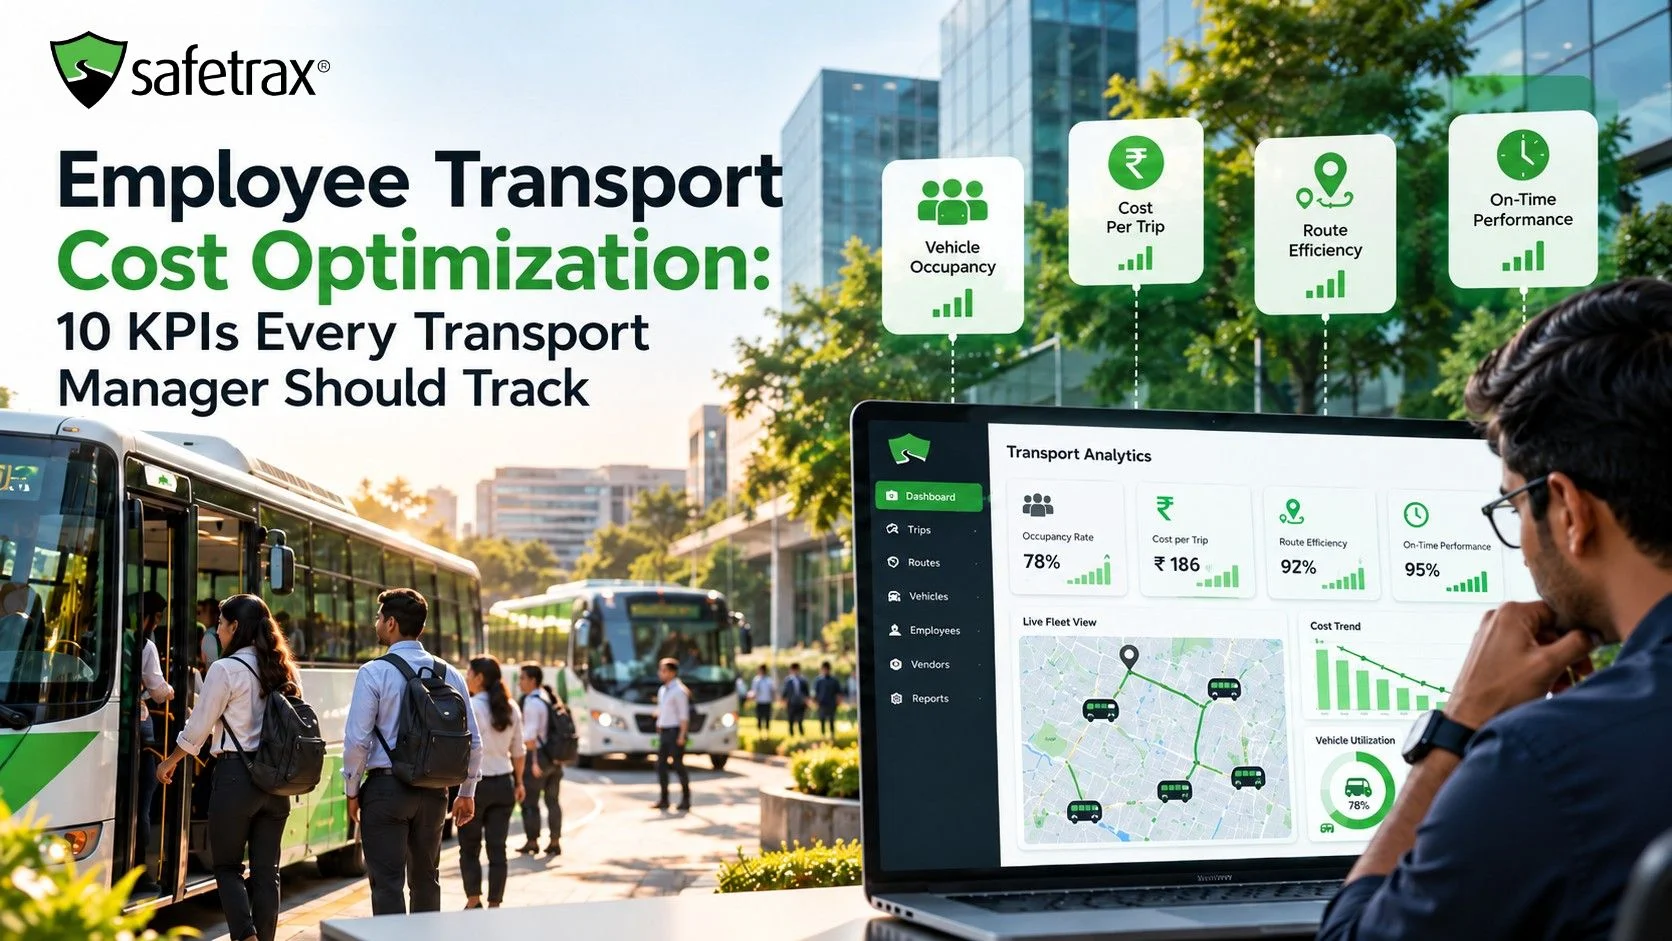
Here are 10 KPIs every transport manager should track.
1. Vehicle Occupancy Rate
One of the most important questions is simple:
How many seats are you paying for versus how many are actually being used?
A vehicle operating at 40% occupancy may still complete every trip successfully, but financially, it could be inefficient. Low occupancy may indicate poor route planning, changing employee rosters or unnecessary vehicle deployment.
Track average occupancy by route, shift and location to identify opportunities for consolidation.
2. Cost Per Employee Trip
Monthly transport spend alone does not tell the complete story.
A more meaningful KPI is:
Cost per employee trip = Total transport cost ÷ Total completed employee trips
Track this across locations, routes, shifts, vendors and vehicle categories. Two offices may have similar transport budgets but completely different cost-per-trip figures.
This KPI helps transport teams understand where costs are being generated.
3. Cost Per Kilometer
Are you paying for productive kilometers or unnecessary movement?
Track planned versus actual kilometers, route deviations, dead kilometers, detours and vendor-wise kilometer costs.
If actual distance consistently exceeds planned distance, the issue may not be the vendor rate.
It may be the route itself.
4. Route Efficiency
Same shift. Nearby pickups. Different cabs.
That is where unnecessary transport costs often begin.
Transport managers should monitor route length, employees per route, number of stops, overlapping routes, pickup sequence and actual versus planned travel time.
Employee rosters change continuously, which means a route that worked three months ago may not be efficient today.
5. Vehicle Utilization Rate
A vehicle may be available for ten hours but effectively used for only a fraction of that time.
Track:
- Trips completed per vehicle
- Active operating time
- Idle time
- Vehicle allocation frequency
- Shift-wise utilization
Low utilization can indicate excess capacity or poor allocation. The goal should not be maximum utilization, but optimal utilization.
6. Employee No-Show Rate
A cab was planned.
A seat was reserved.
But the employee did not board.
The cost still exists.
Tracking scheduled employees versus actual boarding helps transport teams identify repeat no-shows and understand real demand patterns.
Better boarding visibility can support more efficient future planning.
7. Cancellation Rate
Not every cancellation is costly.
But poorly managed last-minute cancellations often are.
Track employee cancellations, vehicle cancellations, vendor cancellations, cancellation timing and related costs.
Early cancellations may allow routes to be adjusted. Last-minute cancellations often do not.
8. On-Time Performance
Transport delays are not just an employee experience problem.
They can also increase operating costs through additional waiting time, longer routes, repeated coordination, shift disruption and vendor escalations.
Monitor on-time pickup, on-time arrival, average delay and recurring delay locations.
9. Vendor Performance vs. Cost
The cheapest vendor is not always the most cost-effective.
A low-cost vendor can create hidden expenses through delays, vehicle unavailability, poor compliance, cancellations and repeated service issues.
Compare cost with on-time performance, trip completion rate, availability, compliance and SLA adherence.
10. Transport Exceptions Per 100 Trips
Driver unavailable.
Employee not boarded.
Vehicle delayed.
Route changed.
Vendor not responding.
These exceptions consume administrative time and can increase transport costs.
Track the number of operational exceptions per 100 trips and measure how quickly they are resolved.
How Safetrax Helps
Safetrax is an Employee Transportation Management Solution that helps enterprises centralize visibility across routes, trips, employees, vendors, boarding, exceptions and transport analytics.
Instead of managing employee transportation through disconnected spreadsheets, calls and vendor reports, Safetrax helps transport teams monitor operations from a common platform and identify opportunities to improve utilization, routing and everyday transport efficiency.
The objective is not simply to find a cheaper cab.
It is to build a more measurable, predictable and efficient employee transportation operation.
Final Thought
Employee transport costs are created trip by trip, route by route and seat by seat.
So instead of asking only:
“How much are we spending?”
Ask:
“How efficiently are we using what we already pay for?”
That question can reveal far more opportunities for meaningful Employee Transport Cost Optimization.