 Sign up with Google
 Sign in with Zoho

What is the connection between a questionable transaction, a delayed shipment, and a lost customer? Possibly much more than what you can see on your dashboard.
Conventional analytics views each as a distinct event that belongs to a different team. However, business issues seldom stay in one area. Until someone notices the connection between the flagged account, the delayed shipment, and the churned client, everyone continues to solve their own part of the issue.
The connections are already there. Most tools just are not built to see them. They count what happened rather than map how it happened. Graph analytics transforms that, uncovering the relationships buried behind your data. That's when true understanding for businesses starts.
Why Traditional Analytics Misses the Connections That Matter Most
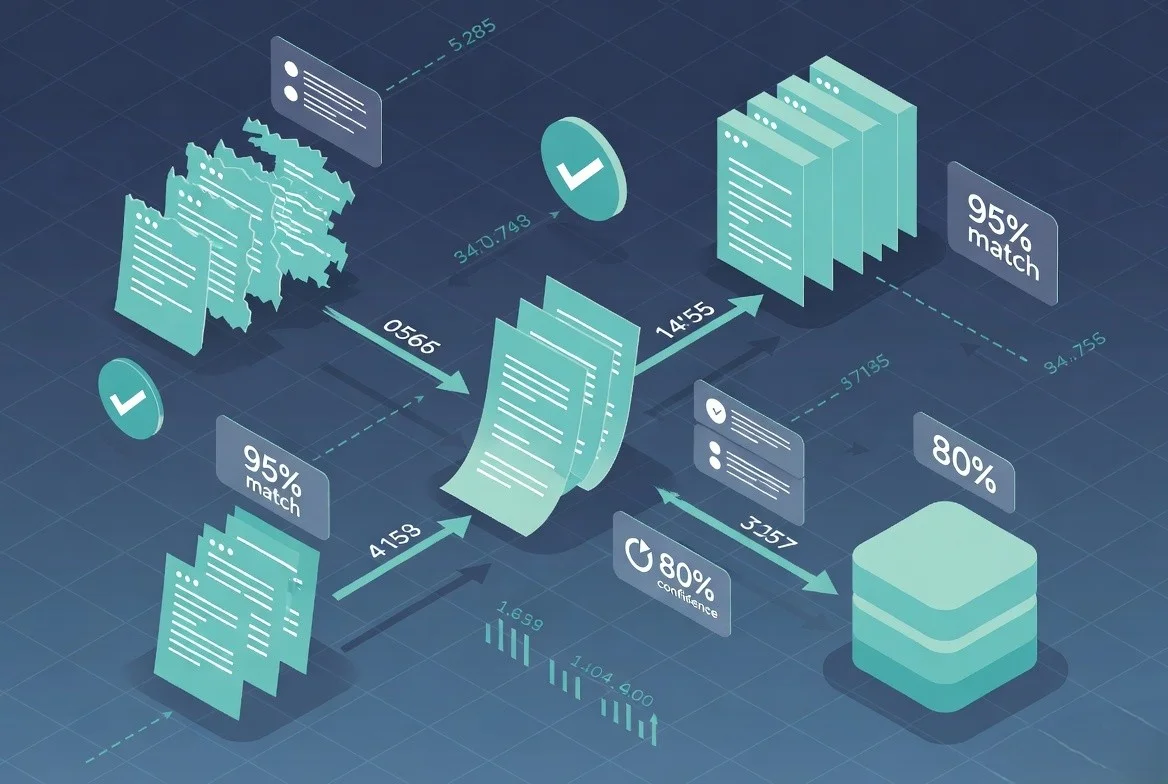
Most enterprise analytics tools are built to summarize, not to connect. They were never intended to trace the relationships between the many components, but they can tell you what transpired in a single system, funnel, or department.
The most crucial business signals typically lurk in that gap. A decline in customer happiness, a delay in delivery, and an increase in transactions that have been flagged may all be sitting in separate dashboards that belong to different teams, and no one will be able to connect them until actual harm is done.
Here are the core reasons traditional analytics falls short:
- Built for aggregation, not association
- Data siloed by department, not by relationship
- Flags individual events, misses connected patterns
- Struggles with multi-hop questions like "who is linked to whom"
- Treats every data point as independent, even when it isn't
This is why enterprises leaning on advanced analytics solutions are shifting focus from isolated metrics to relationship-aware insight.
How Graph Analytics Connects the Dots Across Enterprise Data
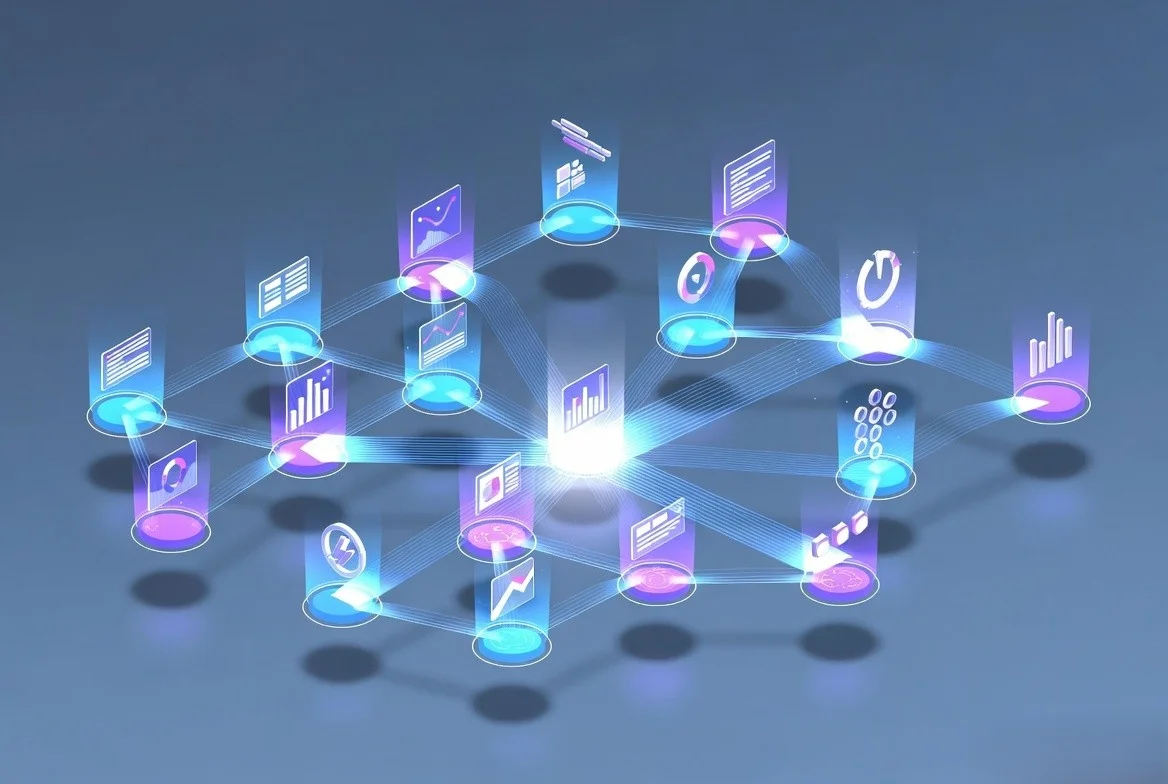
Compared to the tools that most businesses are accustomed to, graph analytics operates differently. A client, a transaction, a supplier, and a support request can all be on the same map, connected precisely as they are in real life, because it stores data as nodes and relationships rather than rows and columns.
Graph-based methods are becoming essential to AI systems' reasoning over enterprise data because of this change from isolated records to linked context.
By 2029, Gartner expects 40% of enterprises to be using GraphRAG techniques to make their AI systems more accurate and better at reasoning.
Here is where that connective power shows up across the business:
- Fraud detection: Graphs show hidden relationships between transactions, devices, or accounts that, when joined, provide a clear pattern even when they don't seem related on their own.
- Customer 360: Instead of using segregated profiles, graphs that depict the relationships between consumers, households, and influencers reveal who actually affects purchase decisions inside a buying group or account.
- Supply chain risk: A disturbance two or three levels upstream is ideally visible before it discreetly reaches your production line because graphs illustrate dependencies across supplier tiers.
- IT and network operations: Graphs show the interdependence of servers, apps, and systems, which expedites root cause analysis when a single failure triggers a chain reaction.
- Workforce and organizational insight: By contrasting the real flow of knowledge with what the organizational chart shows, graphs show informal networks of collaboration inside teams.
- Agentic AI grounding: By providing AI agents with structured context and memory, graphs enable them to make judgments based on related facts rather than discrete data points extracted from disparate systems.
Why Is Graph Analytics Becoming Critical Infrastructure for Agentic AI and GenAI?
The majority of businesses are realizing that flat, disjointed data just cannot support that level of reasoning, since agentic AI systems are only as good as the context they can reason over.
This is why more businesses are turning to top data analytics services companies to help them build the connected data foundation agentic AI actually needs.
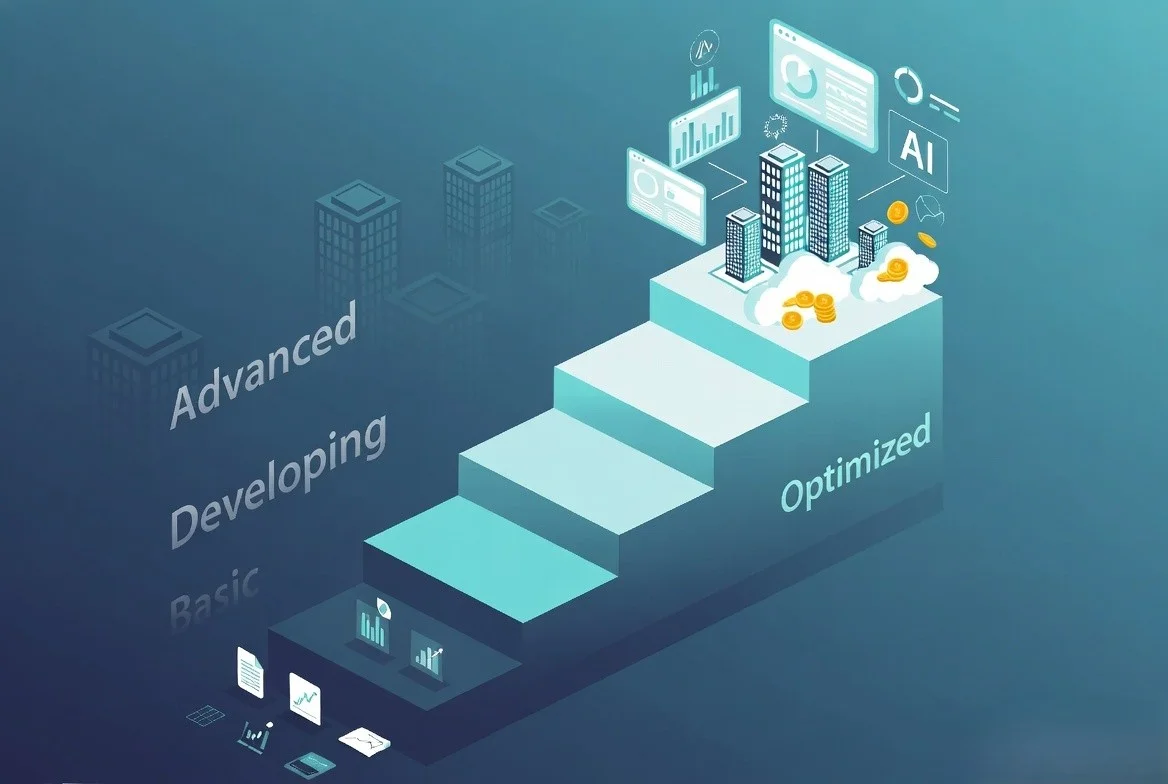
Here’s why graphs are becoming non-negotiable for AI maturity:
- Grounded reasoning: Rather than making confident guesses based on inadequate or disjointed information, agents need structured context rather than dispersed data points to make trustworthy conclusions.
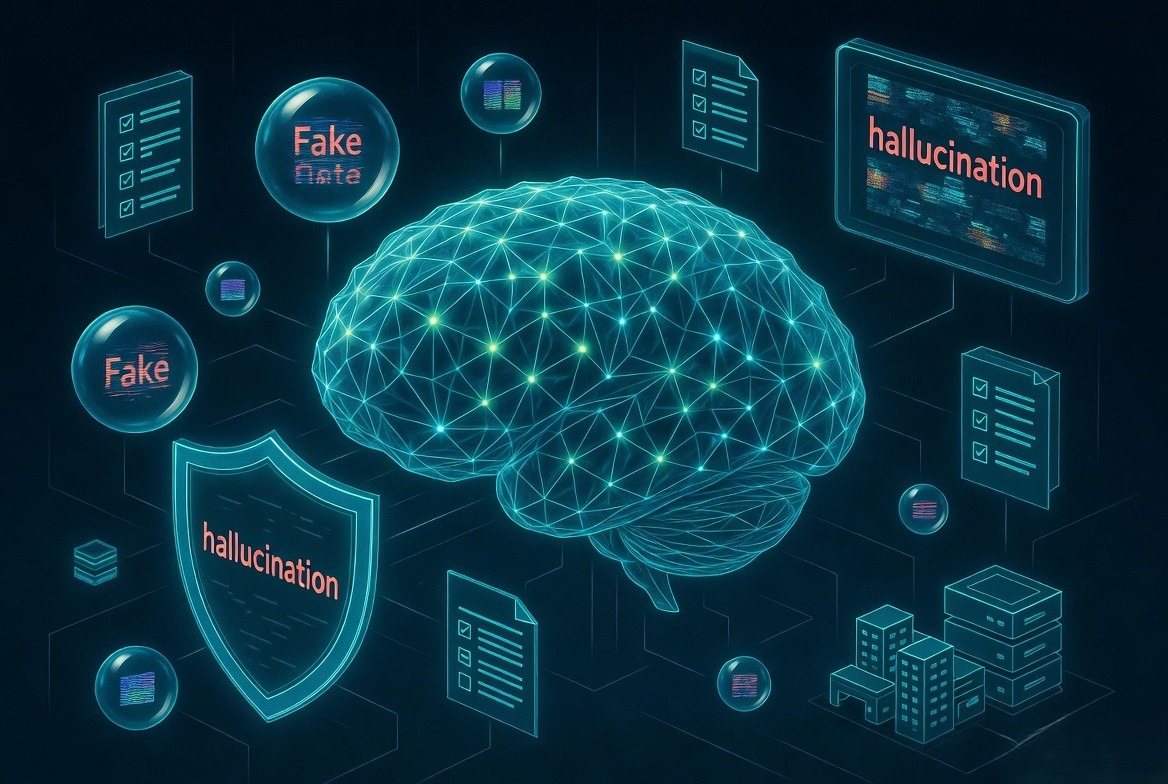
- Reduced hallucination: GraphRAG helps pin language models to relationships that are already established between entities, so it cuts down those replies that sound right but end up being wrong.
- Faster deployment with the right partner: By working with a top data analytics services company, enterprises can turn fragmented data into graphs quicker. And you don’t have to build this capability, this specific capacity, from scratch internally.
- Multi-agent coordination: Agents that operate together need one shared connected picture of accounts, processes, and dependencies. Without that, they tend to duplicate work or make conflicting calls across different systems, even if each agent is working correctly by itself.
- Contextual memory: Graphs also give AI agents a way to keep and reuse relationships over time. Instead of treating every single interaction like a disconnected, memoryless moment.
- Semantic consistency: Graphs anchor AI systems to a common structured meaning of business terms and entities. This helps stop the fragmented interpretations that often show up in big siloed data environments.
Turn Your Most Costly Data Gap Into a Starting Point
Look for the moments when teams say, "We had the data, but we did not see it coming." Trace what was missed, which systems held the clues, and which relationships would have made the pattern visible sooner. That alone gives you a practical first graph analytics use case, with a clear business outcome attached.
Straive helps enterprises connect fragmented data and build the analytics foundations that support sharper decisions today and more context-aware GenAI and agentic AI systems tomorrow.
The biggest insight is not always buried deep in the data. Sometimes it is just hiding in the space between two things nobody thought to connect. Make sure you do not leave that space unexplored.