 Sign up with Google
 Sign in with Zoho
Launching a large language model application is only the beginning. A chatbot, AI assistant, document summarizer, or Retrieval-Augmented Generation system may perform well during development, but production environments introduce real users, unpredictable prompts, changing data, traffic spikes, and strict business expectations.
Traditional application monitoring focuses on uptime, server errors, memory usage, and request volume. These metrics still matter, but LLM applications require an additional layer of visibility. Teams must understand how quickly the system responds, how much each interaction costs, and whether the generated output is actually useful.
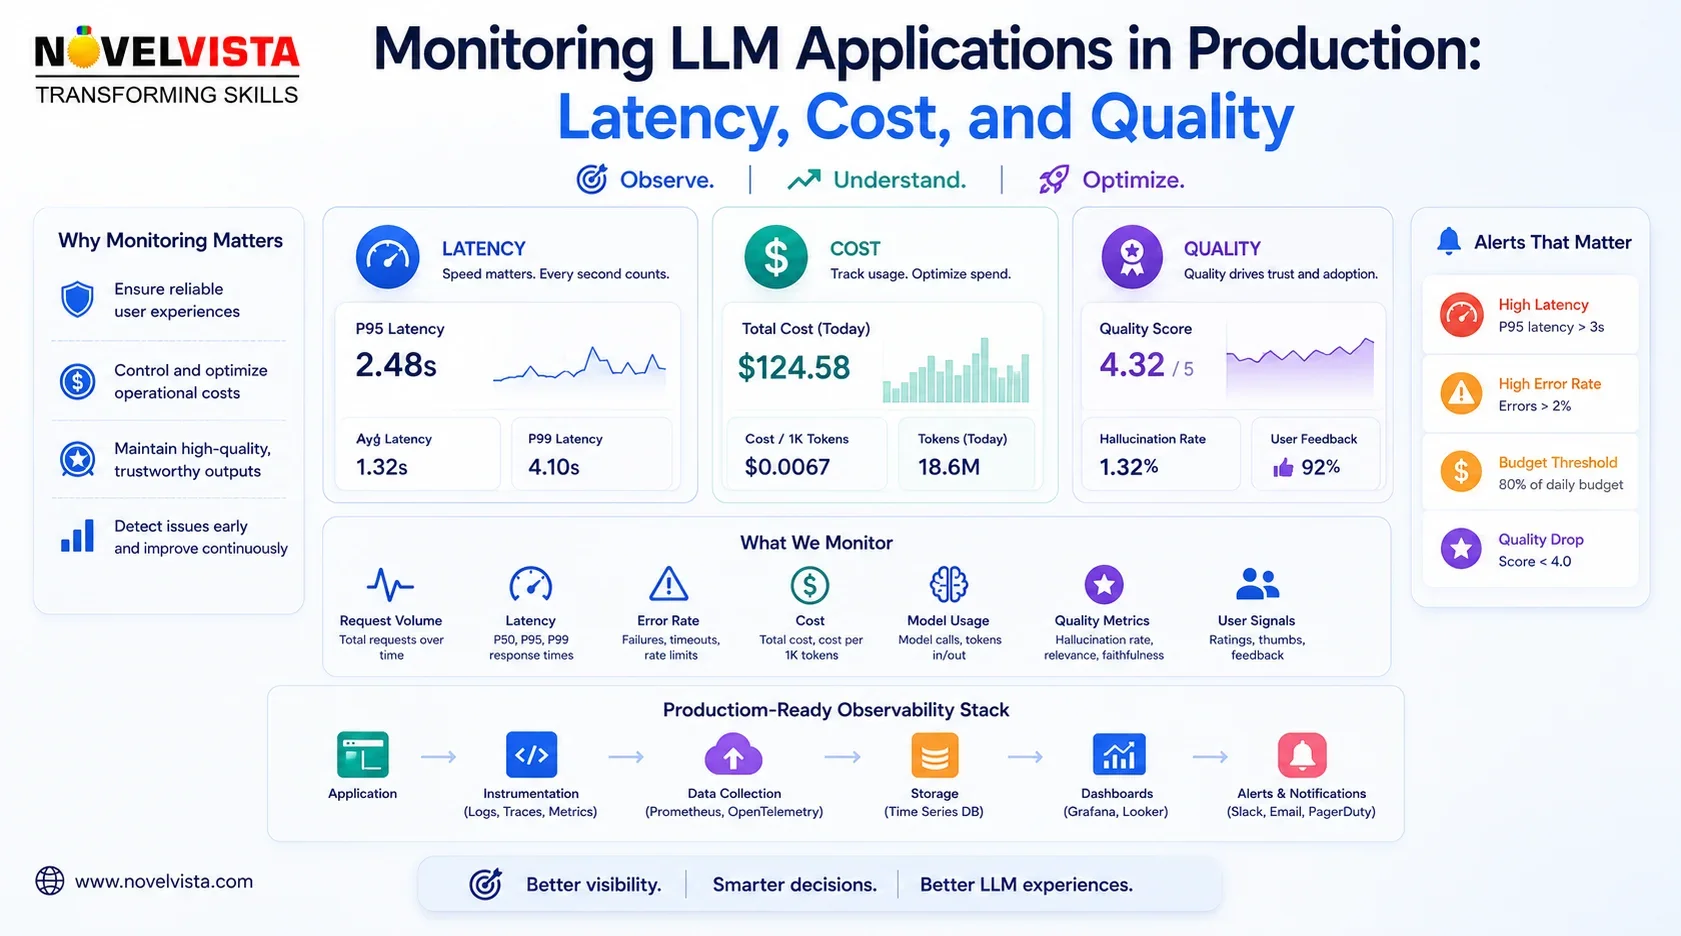
For most production LLM applications, monitoring should be built around three core areas: latency, cost, and quality.
Why LLM Monitoring Is Different
A conventional software function usually produces a predictable output for a given input. An LLM application is probabilistic. The same request may produce slightly different responses, token usage, processing times, and tool calls.
The final response may also depend on several components, including prompt templates, language models, vector databases, retrieval systems, external APIs, safety filters, and agent tools.
When something goes wrong, a simple error message may not reveal the real cause. A slow response could be caused by the model, document retrieval, a third-party service, or an agent repeatedly calling the same tool. Monitoring must therefore capture the complete request journey rather than only the final API result.
Monitoring Latency
Latency measures how long the application takes to respond. In user-facing applications, even a correct answer can feel unsuccessful when the user has to wait too long.
Teams should begin by measuring total response time. However, this number should also be divided into individual stages, such as prompt preparation, document retrieval, model processing, tool execution, safety checks, and response formatting.
For streaming applications, two latency measurements are especially useful. The first is time to first token, which shows how quickly the application begins responding. The second is total generation time, which measures how long it takes to complete the full answer.
Instead of relying only on average response time, teams should monitor percentiles such as p50, p95, and p99. An acceptable average can hide a small but important group of extremely slow requests.
Latency should also be analysed by model, feature, prompt type, user group, and request complexity. A short classification request should not be measured against a research agent that performs multiple searches and tool calls.
When latency increases, teams can investigate options such as using a smaller model, limiting response length, caching repeated results, processing independent tool calls in parallel, or reducing unnecessary retrieval steps.
Monitoring Cost
LLM costs can grow quickly when an application reaches production scale. Every prompt, generated response, embedding request, tool call, and retry may contribute to the final operating cost.
The first step is tracking input and output token consumption for each request. Output tokens are often more expensive than input tokens, so uncontrolled response length can significantly increase spending.
Cost should be monitored at several levels, including cost per request, user, feature, model, customer, department, and workflow. This helps teams understand where the budget is being consumed and whether the spending creates sufficient value.
For an AI agent, one user request may trigger several model calls before producing the final answer. Without detailed tracing, the application may appear affordable at the interface level while performing expensive reasoning loops in the background.
Teams should also monitor failed requests, retries, duplicated retrieval, unnecessary context, and repeated tool calls. These activities consume resources without improving the user experience.
Cost controls may include token limits, usage quotas, model routing, prompt compression, semantic caching, response caching, and approval requirements for expensive workflows. A practical approach is to use lightweight models for simple tasks and reserve advanced models for requests that genuinely require deeper reasoning.
Monitoring Response Quality
Latency and cost can be measured numerically, but quality is more difficult. A response may be fast and inexpensive while still being inaccurate, irrelevant, incomplete, or misleading.
Quality monitoring should begin with clearly defined expectations. A customer-support assistant may be evaluated on resolution accuracy, policy compliance, and helpfulness. A RAG application may be measured on retrieval relevance, groundedness, citation accuracy, and answer completeness.
Automated evaluations can score responses using predefined rules, test datasets, similarity checks, or model-based evaluators. However, automated scoring should not fully replace human review.
Human evaluators can identify issues that technical metrics miss, such as unclear language, inappropriate tone, unsupported recommendations, or answers that technically contain the correct information but fail to address the user’s actual question.
User feedback is another valuable signal. Ratings, corrections, repeated questions, abandoned conversations, and escalation to human support can reveal where the application is underperforming.
For RAG systems, retrieval quality should be monitored separately from generation quality. If the correct document was never retrieved, the language model may not have had enough information to answer correctly. Useful retrieval metrics include whether the expected source appeared in the results, the relevance of retrieved chunks, and how much irrelevant context was included.
Use End-to-End Tracing
A production LLM application should generate a trace for every request. The trace should show the input, prompt version, selected model, retrieved documents, tool calls, token usage, latency, output, errors, and evaluation results.
Sensitive information should be masked or removed before logs are stored. Access to traces must also be controlled because prompts and responses may contain confidential organizational or customer data.
Tracing allows teams to move from “the AI gave a bad answer” to a specific diagnosis. For example, the system may have retrieved an outdated policy, used the wrong prompt version, exceeded its context limit, or called an unavailable service.
Establish Alerts and Baselines
Monitoring becomes useful when teams know what normal performance looks like. Establish baseline ranges for latency, cost, retrieval performance, failure rate, and quality scores.
Alerts can then be triggered when p95 latency rises, average cost per request increases, tool failures cross a threshold, or quality scores decline after a prompt or model change.
Every model, prompt, retrieval configuration, and knowledge-base update should be versioned. This makes it possible to compare performance before and after a change and quickly roll back a harmful release.
Final Thoughts
Production monitoring is what turns an LLM prototype into a dependable business application. Without it, teams may discover rising costs, slow responses, and declining answer quality only after users begin complaining.
The goal is not to optimize latency, cost, or quality independently. Reducing cost by selecting a weaker model may damage accuracy. Increasing retrieved context may improve completeness but also increase latency and token usage.
The strongest monitoring strategy connects all three dimensions. It helps teams understand not only whether the application is working, but whether it is delivering reliable value at an acceptable speed and sustainable cost.