 Sign up with Google
 Sign in with Zoho

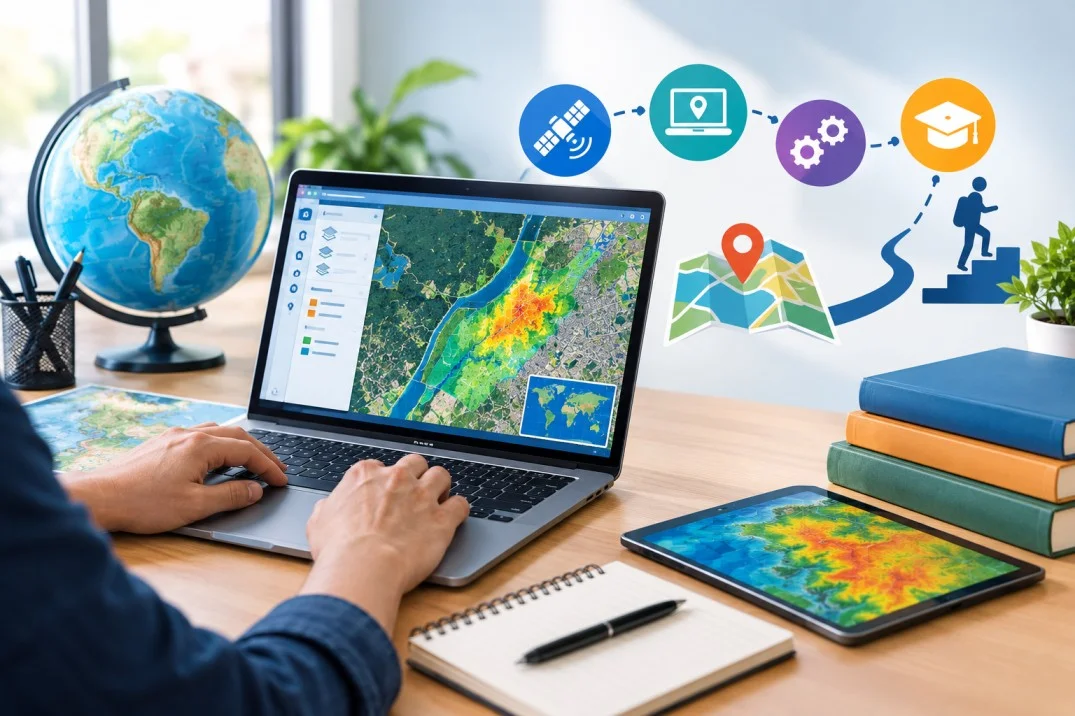
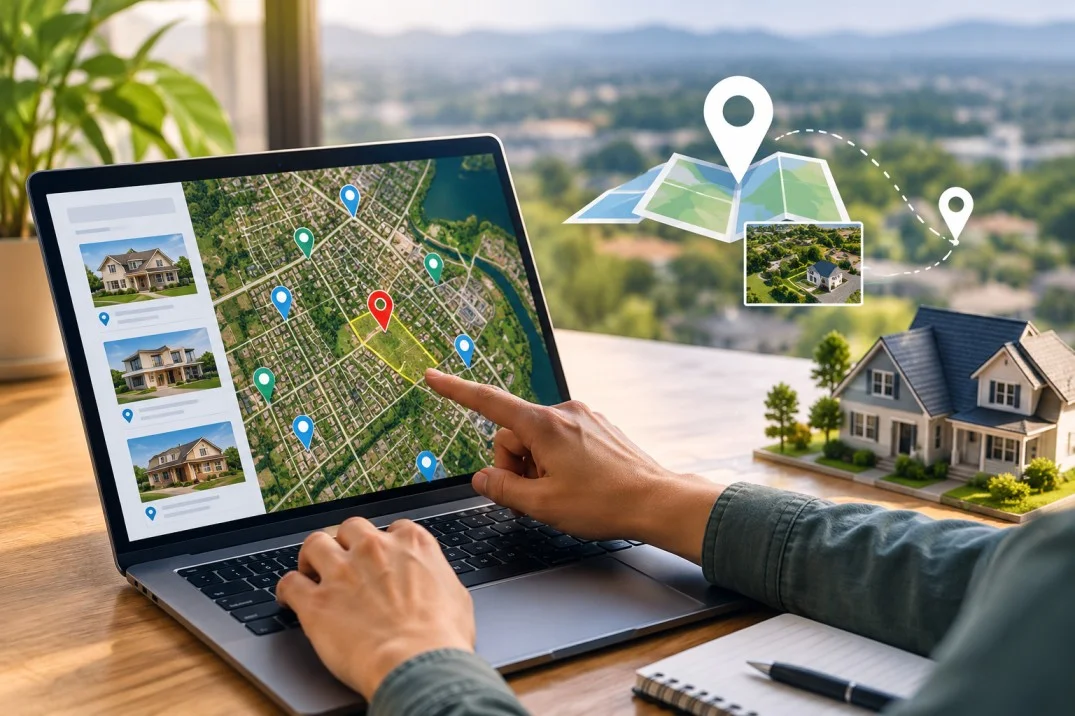
Digital mapping turns location data into visual information you can use to make decisions. If you want to plot property boundaries, analyze terrain, or build an interactive web map, you start with the same basics: data, software, and a clear method for displaying results. For many beginners, the first practical step is learning how US map software handles state, county, and parcel data so you can create a map that is accurate and readable.
What Digital Mapping Means Today
Digital mapping is the process of collecting spatial data and rendering it in software. Two data types drive almost every map.
Vector data uses points, lines, and polygons. A point can mark a house. A line can show a road. A polygon can outline a county or a flood zone.
Raster data uses a grid of cells. Satellite imagery, elevation models, and aerial photos are rasters. Each cell holds a value, such as height or temperature.
Modern platforms combine both types. You can overlay parcel polygons on top of aerial imagery, add census data, and then run analysis to answer questions like where to build, what land is vacant, or how slope affects access.
Core Tools Beginners Should Know
You do not need every platform at once. Start with one simple builder and one professional GIS for growth.
Entry Level Map Builders
Google My Maps, MapChart, and Atlas let you create a custom United States map in minutes. You can color states, drop pins, import a spreadsheet of addresses, and share a link. These tools are free or low cost and require no installation. They are best for presentations, travel tracking, or quick visual explanations.
They have limits. You cannot run a slope analysis, check wetland overlap, or join large datasets. For that, you need GIS.
Understanding US Map Software Options
Professional us map software includes QGIS and ArcGIS Pro. QGIS is free, open source, and runs on Windows, Mac, and Linux. It supports shapefiles, GeoJSON, GeoTIFF, and connections to databases. ArcGIS Pro is the commercial standard used by many agencies and companies for advanced analysis, 3D visualization, and large project management.
Both let you work with nationwide datasets like the National Map from USGS, census TIGER/Line files, and county parcel data. Other useful tools include Google Earth Pro for visual inspection and Mapbox GL JS if you want to publish interactive maps on a website. Beginners often start in QGIS to learn core concepts without a license cost, then add ArcGIS Online for collaboration.
Essential Skills for Digital Mapping
Tools change. Skills carry over.
Working With Spatial Data
Learn how coordinate systems work. In the United States, you will see WGS 84 for web maps and NAD 83 with state planes or UTM zones for measurement. If your layers use different systems, your map will not align.
Practice data preparation. That means cleaning attribute tables, joining a CSV of owners to parcel polygons, filtering by criteria such as vacant status or road frontage, and checking for errors. Understanding file formats matters. Shapefile, GeoJSON, and File Geodatabase store vector data. GeoTIFF and IMG store raster.
Map Design and Analysis
Good cartography makes a map readable. Choose simple color schemes, label only what matters, and add a legend, scale bar, and north arrow. Keep text legible at your export size.
Analysis is where GIS adds value. Common beginner operations include buffer to find areas within a distance, clip to isolate features inside a boundary, intersect to find overlap between wetlands and parcels, and calculate slope from elevation data. Each tool answers a specific question, so define the question first.
How to Choose Your First GIS MAP Course
A good GIS MAP course teaches workflow, not only buttons. Look for these criteria before you enroll.
- Software focus. Confirm whether the course uses QGIS, ArcGIS Pro, or both. If you want a free path, pick QGIS. If your employer uses Esri products, pick ArcGIS Pro.
- Project-based lessons. The course should include real datasets, like census data or parcel data, and end with a finished map layout.
- Coverage of data sources. It should show where to get authoritative US data and how to evaluate its date and accuracy.
- Support and updates. GIS interfaces change. A course updated in 2025 or 2026 with office hours or a community forum helps you avoid outdated steps.
- Time and outcome. Beginners can finish a fundamentals course in 8 to 20 hours. Longer certificate programs add Python for GIS, spatial statistics, and web publishing.
Avoid courses that promise mastery in a few videos without practice files. Learning happens when you replicate the steps with your own data.
A Practical Learning Path From Zero to First Map
This path works for students, land investors, and professionals switching into geospatial work.
- Step 1: Learn concepts. Spend a day on what vector and raster mean, how projections work, and how attribute tables connect to geometry.
- Step 2: Install QGIS and add basemaps. Add a US states layer and practice selecting, filtering, and labeling.
- Step 3: Import a spreadsheet. Use county data or a list of addresses, geocode if needed, and symbolize by category.
- Step 4: Run two analysis tools. Try buffering and intersecting with sample data, such as parcels intersecting a floodplain.
- Step 5: Export a layout. Create a print-ready PDF with a title, legend, and data source note.
- Step 6: Repeat with a new dataset that matches your interest, such as vacant land, soils, or market comps. This repetition builds judgment about what looks correct.
Platforms that focus on land data, like Land Portal, illustrate how these skills apply in practice. Land Portal aggregates nationwide MLS, parcel, and owner data and applies filters for vacant land, wetlands, slope, road frontage, and FEMA zones, which are exactly the layers beginners learn to use in GIS.
Key Takeaway
Digital mapping starts with clear data and a defined question, then moves to the right software and repeatable steps. Learn one entry-level builder for quick maps and one professional GIS for analysis, practice with real US datasets, and choose a course that teaches complete workflows. Once you can prepare data, check its projection, run basic geoprocessing, and export a clean layout, you can build maps that support decisions rather than only display location. That foundation also makes evaluating advanced us map software and the next GIS MAP course much easier.