
 Sign up with Google
 Sign in with Zoho

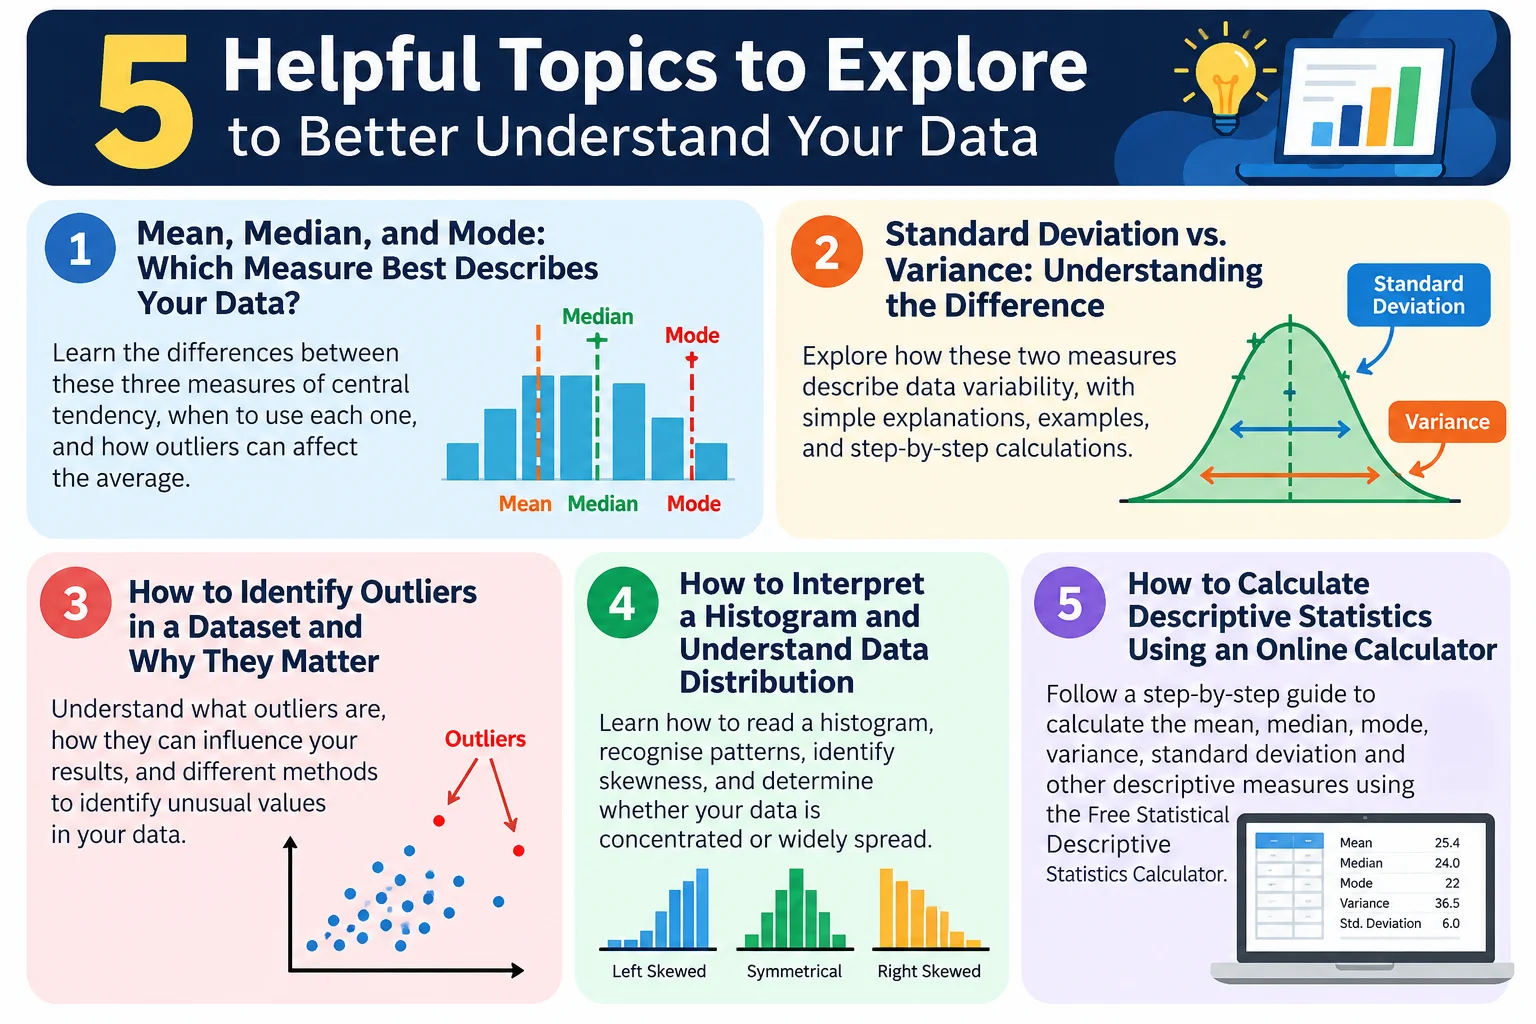
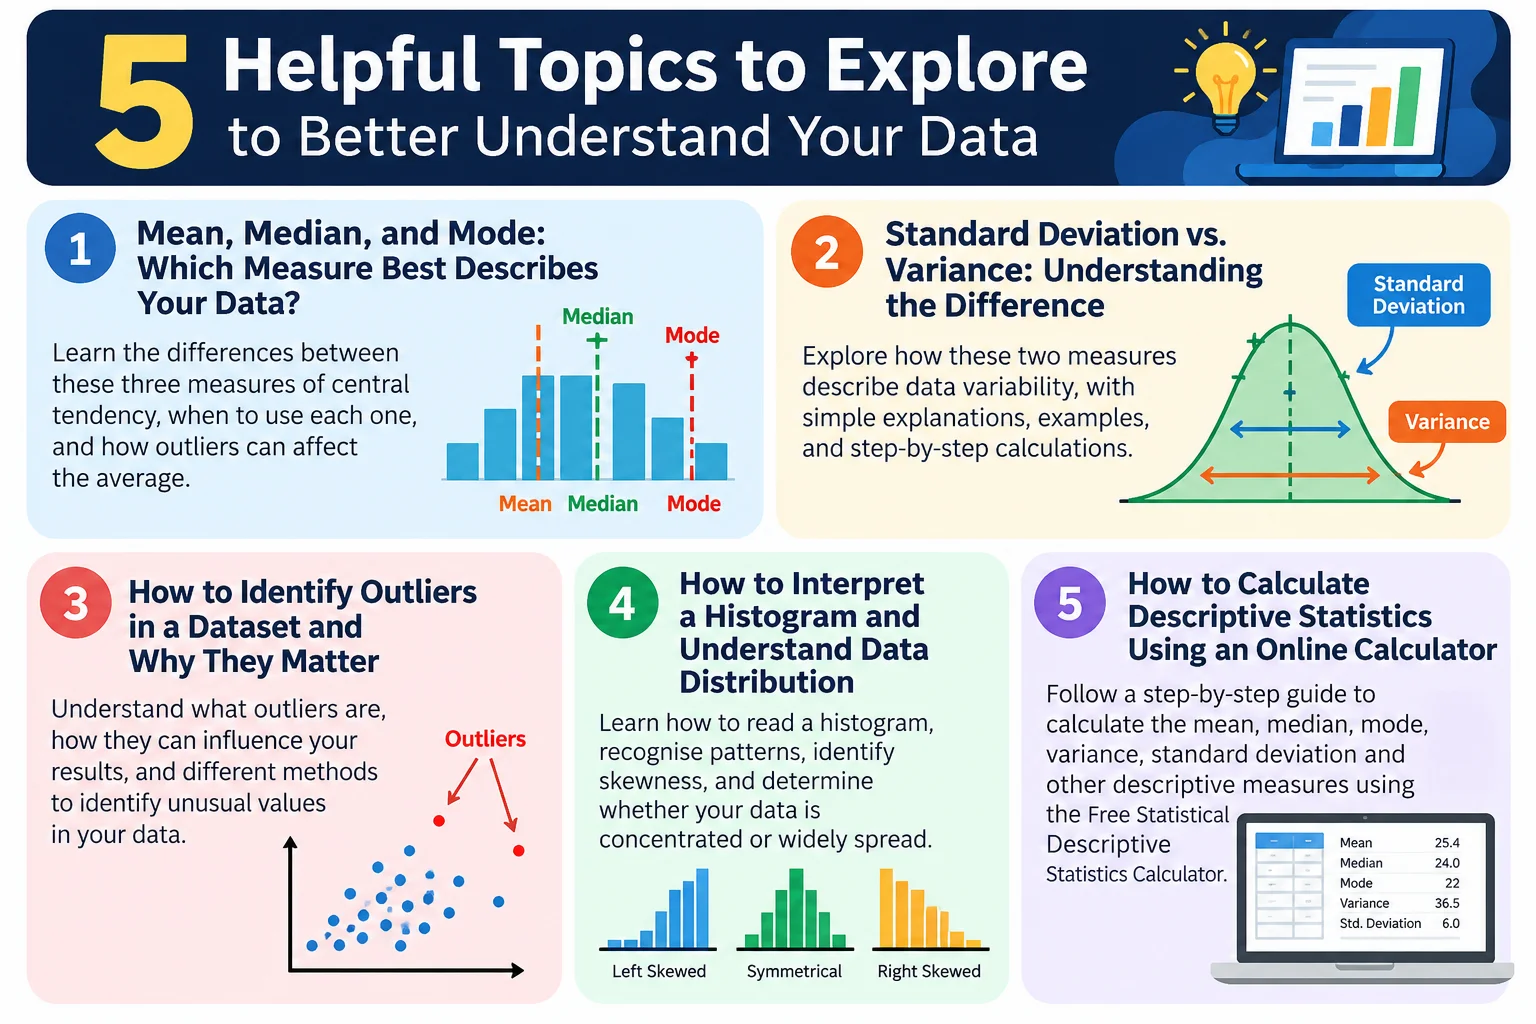
In today's data-driven world, understanding numerical information is an important skill for students, researchers, and business professionals. Descriptive statistics help turn raw data into meaningful information that is easier to interpret and communicate.
What Are Descriptive Statistics?
Descriptive statistics are methods used to summarize the main characteristics of a dataset. Instead of examining every observation individually, we can use statistical measures to understand the centre, spread, and distribution of the data.
The most common measures include:
- Mean: The arithmetic average of a dataset.
- Median: The middle value when observations are arranged in order.
- Mode: The most frequently occurring value.
- Range: The difference between the maximum and minimum values.
- Variance and standard deviation: Measures that describe the variability of observations.
- Quartiles: Values that divide ordered data into four parts.
These measures are widely used in business analytics, market research, economics, education, and academic research.
Why Is Variability Important?
Consider two classes that achieve the same average examination score. In the first class, most students score close to the average. In the second class, scores vary significantly.
Although both classes have the same mean, their score distributions are different. Standard deviation helps describe this difference by measuring how spread out the observations are around the mean.
This demonstrates why an average alone may not provide a complete understanding of a dataset.
How Can Students Practise Descriptive Statistics?
A useful approach is to start with a small dataset and calculate the mean, median, range, and standard deviation. Students can then compare their calculations with an online tool to check their understanding.
For practical learning, try this descriptive statistics calculator. It provides a way to explore statistical summaries and practise interpreting numerical data.
When using any calculator, check the input values, understand whether sample or population formulas apply, and interpret the results in the context of the problem.
Applications in Business and Research
Descriptive statistics can help businesses summarize sales performance, compare customer survey responses, examine employee attendance patterns, and understand operational results.
Researchers also use descriptive measures to describe study participants, summarize collected observations, and present findings in tables and charts.
However, descriptive statistics alone do not establish causation or demonstrate whether a difference is statistically significant. Those questions may require additional analytical methods.
Conclusion
Descriptive statistics form the foundation of effective data analysis. By understanding measures of central tendency and variability, students and professionals can summarize information more accurately and make better-informed interpretations.
Regular practice with real datasets is an effective way to develop these skills and prepare for more advanced statistical analysis.