 Sign up with Google
 Sign in with Zoho

Key takeaways
- AI sentiment analysis, also called opinion mining, identifies whether research responses are positive, negative or neutral, names the emotion behind them and measures how strongly it is expressed.
- There are five main types: polarity, graded, aspect-based, emotion detection and multilingual sentiment analysis.
- A seven-step process takes you from a clear research question to an AI report that explains what the sentiment means.
- On Terapage, the outer ring shows high-level mood categories, the inner ring shows granular sentiments, and intensity is measured with average weight and a high, medium or low strength rating.
- Qualitative sentiment analysis explains why people feel something; quantitative sentiment analysis shows how many feel it.
- Every result traces back to verbatim participant quotes, and researchers can ask questions of their data in plain language.
Your survey says 80% of customers are satisfied. Yet sales are falling, and nobody can explain why. The answer is often hiding in the comments people wrote but nobody had time to read.
Sentiment analysis helps you read those comments at scale. On Terapage, AI finds the emotion in every interview, survey and diary entry and links it back to the participant who shared it. It then lets you ask questions of your data in plain language. This guide explains what sentiment analysis is, how it shows AI analysis and reporting at work, and how to use it in both qualitative and quantitative research.
What Is AI Sentiment Analysis?
AI sentiment analysis (noun): the use of artificial intelligence to identify the emotional tone in research responses such as interview transcripts, open-ended survey answers and diary entries. It classifies each response as positive, negative or neutral, names the specific emotion behind it and measures how strongly it is expressed. Also called opinion mining.
Sentiment analysis, also called opinion mining, is "the process of analyzing large volumes of text" to determine whether it expresses a positive, negative or neutral sentiment.
In market and consumer research, it is applied to interview transcripts, open-ended survey answers, diary entries and discussion posts. It answers a question numbers alone cannot: not just what people chose, but how they felt about it. That makes it one of the clearest ways to see how AI analysis turns raw responses into insight.
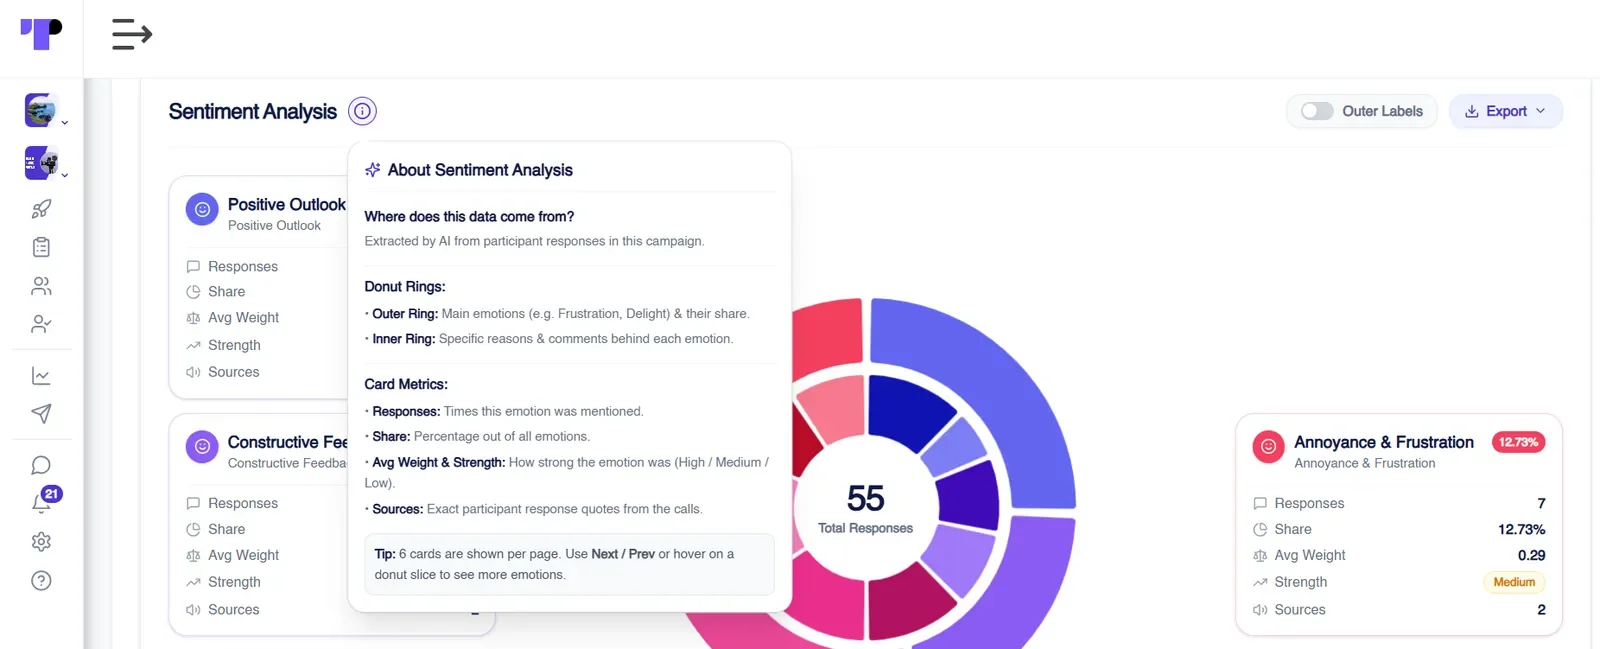
On Terapage, every sentiment result comes with a built-in guide that explains where the data comes from and what each part of the analysis means, from the donut rings to the response, share, weight and strength metrics.
How Does AI Sentiment Analysis Work?
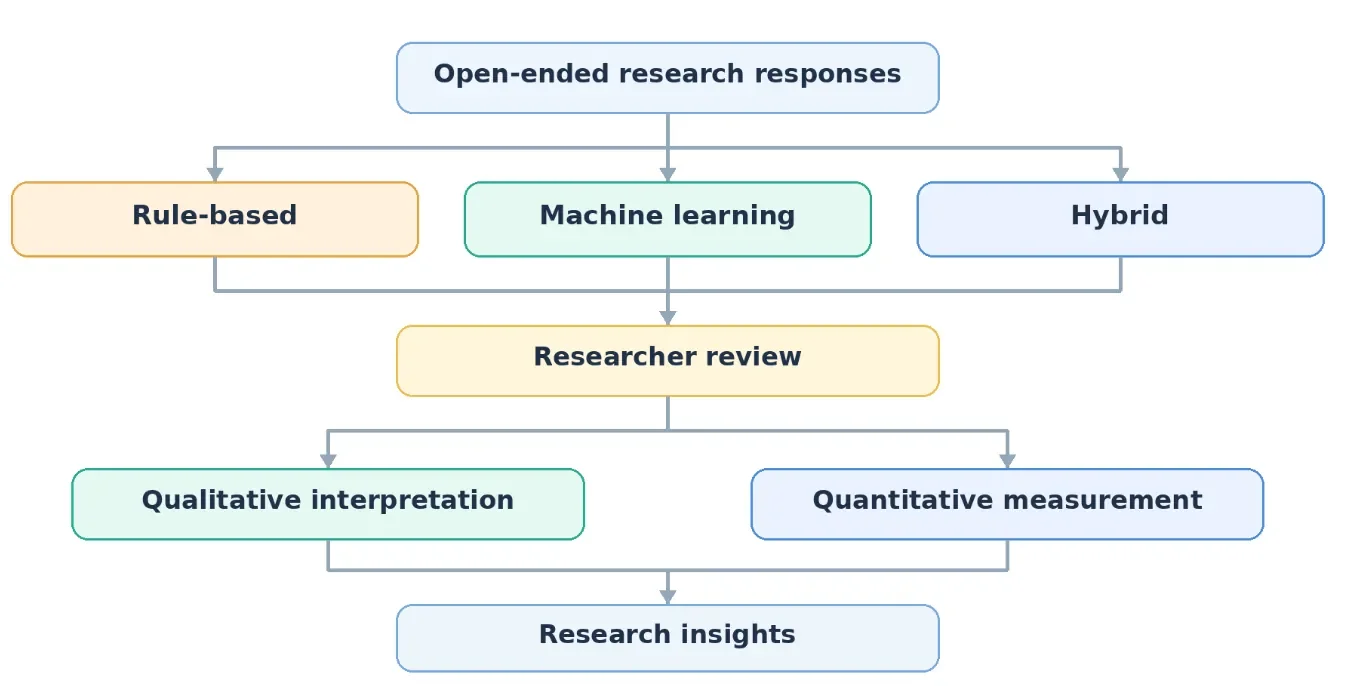
The earliest method of sentiment analysis was rule-based. It used a list of positive and negative words and counted them in each response. It was fast but often missed the meaning. For example, "not bad at all" contains a negative word but actually sounds positive.
Machine learning improved this by learning from thousands of examples, so it could recognise patterns instead of single words. Today, AI goes even further. It reads whole sentences, understands mixed feelings, and describes emotions in plain language. Many tools now combine these methods, and a researcher still reviews the results before they are shared. For a deeper technical look, see Thematic's sentiment analysis guide.
The results then support both sides of a study: detailed understanding in qualitative research and clear numbers in quantitative research. Platforms like Terapage bring this together with AI-powered insights that analyse sentiment across every response.
How Do You Run AI Sentiment Analysis and Reporting? A 7-Step Process
Sentiment analysis works best when you follow a clear process. These seven steps take you from your first research question to a finished AI report, and they work for both qualitative and quantitative research.
Step 1: Define What You Want to Understand
Every sentiment analysis starts with a clear research question. A broad question such as "What do people think of our product?" usually produces broad, hard-to-use results. A focused question such as "How do people feel about our new packaging?" tells you what to look for in the responses and makes the findings much easier to act on.
Step 2: Choose Methods That Capture Emotion
Sentiment analysis can only read what people share, so choose methods that let them speak freely. For qualitative depth, use AI-moderated interviews, chatbot activities and diary studies. For quantitative scale, add open-ended questions to your surveys and polls.
Journal and diary studies capture feelings in the moment and over time. AI-moderated chat interviews and chatbot research activities invite people to explain themselves in their own words, at their own pace.
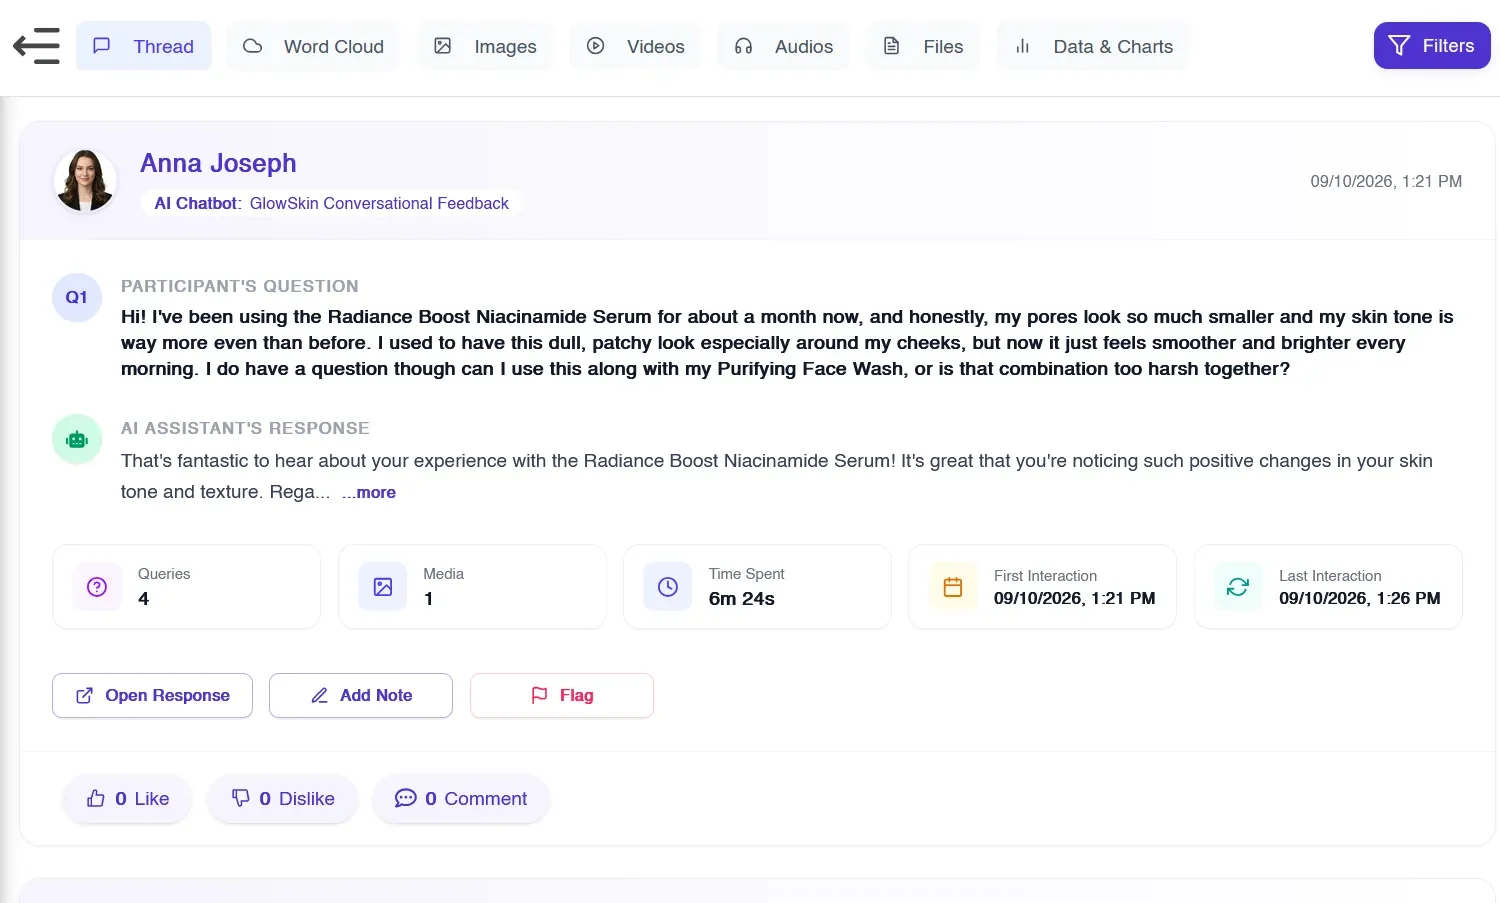
Mobile diary entries go even further. Participants can share video, audio and written notes in one entry, capturing feelings in the moment.
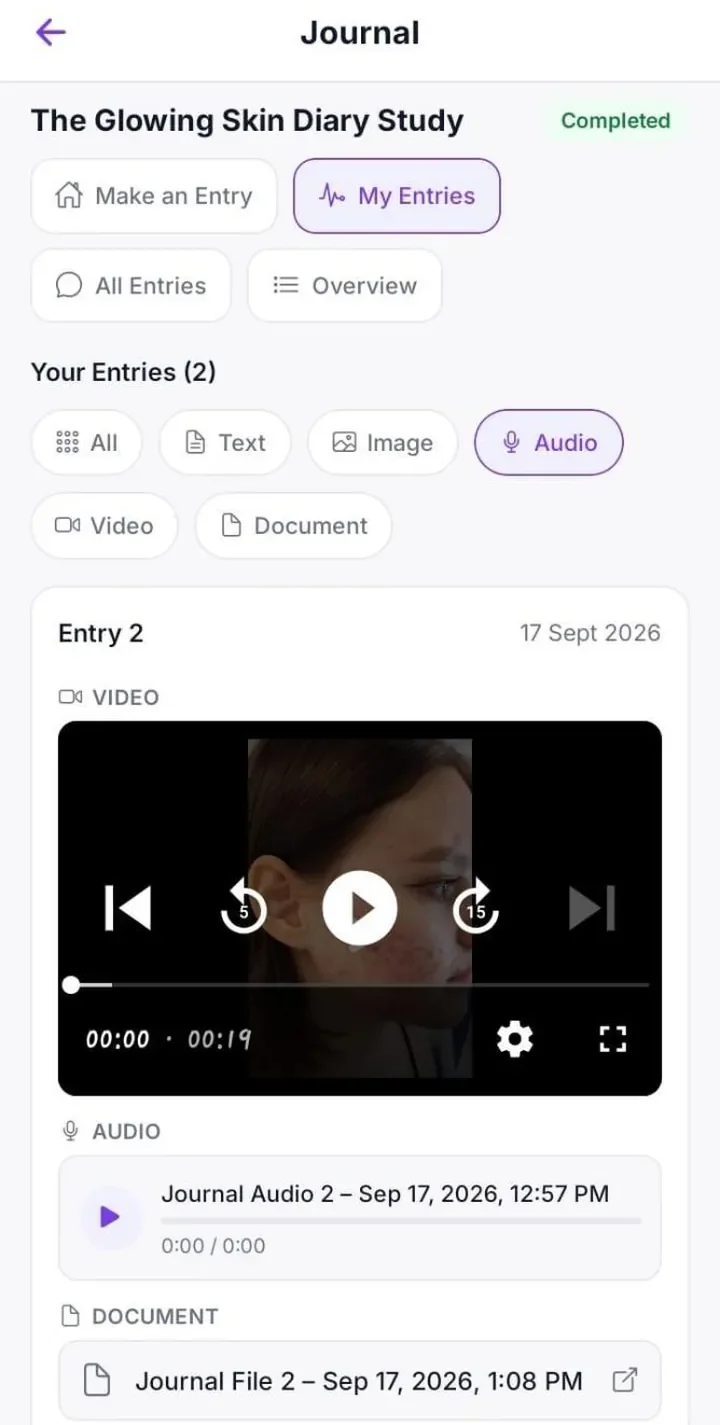
Video reviews capture emotion second by second. In a video review activity, participants react with an emoji at the exact moment something catches their attention and can add a short comment. A timeline then shows where reactions cluster, so you can see which moments delight viewers and which ones lose them.
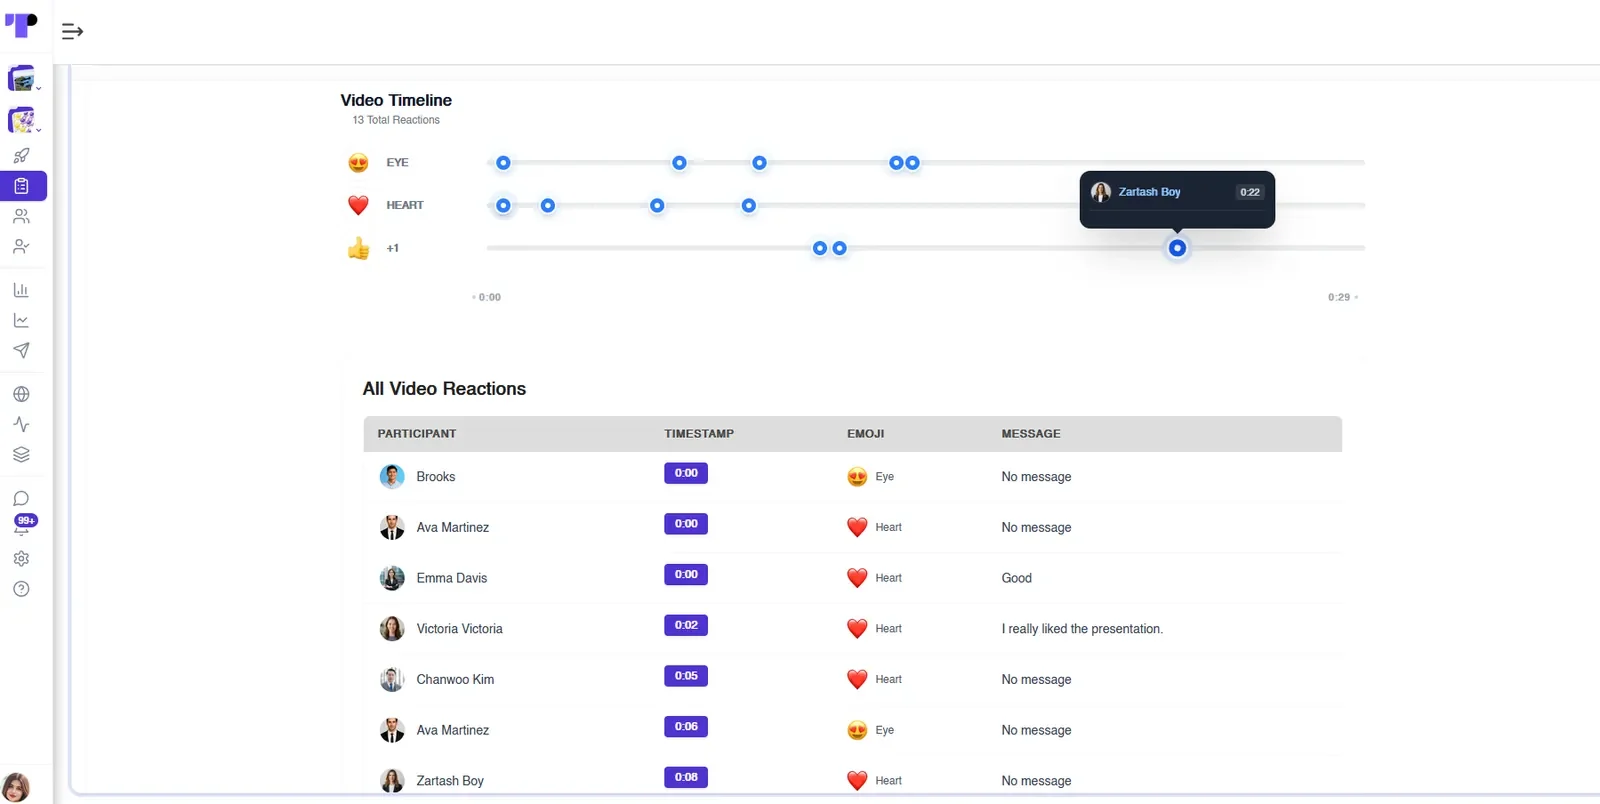
Step 3: Collect Responses
Collect enough responses from each group you want to compare. Make taking part easy, too. When people can respond on any device through a simple participant experience, they share their reactions in the moment, and those reactions are more honest. Offering incentives also helps keep participation high across every group.
As responses arrive, you can see sentiment across every task at once. This shows whether feelings stay the same across audio reviews, written answers and survey questions.
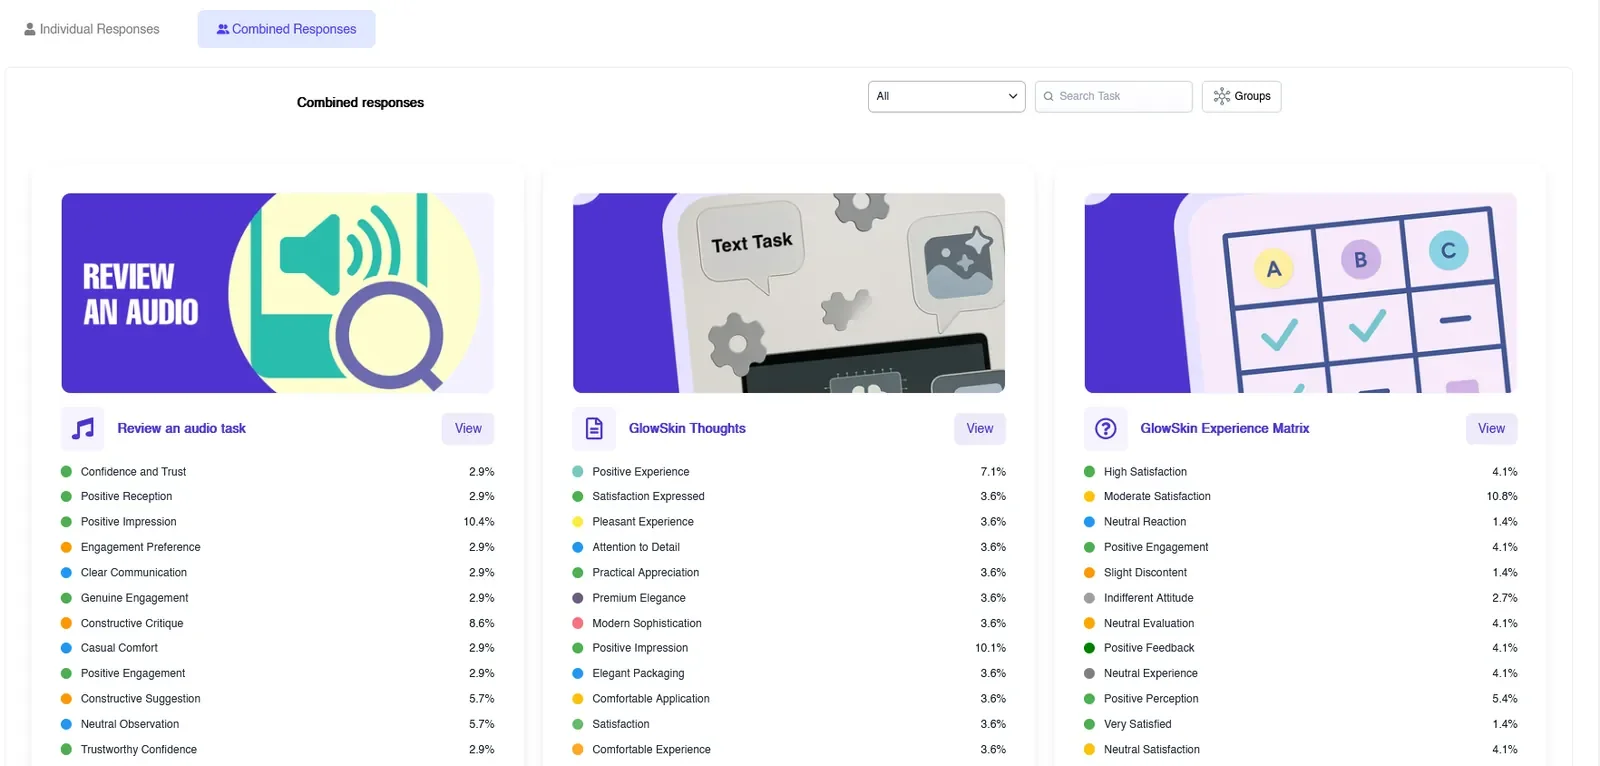
Step 4: Run AI Sentiment Analysis
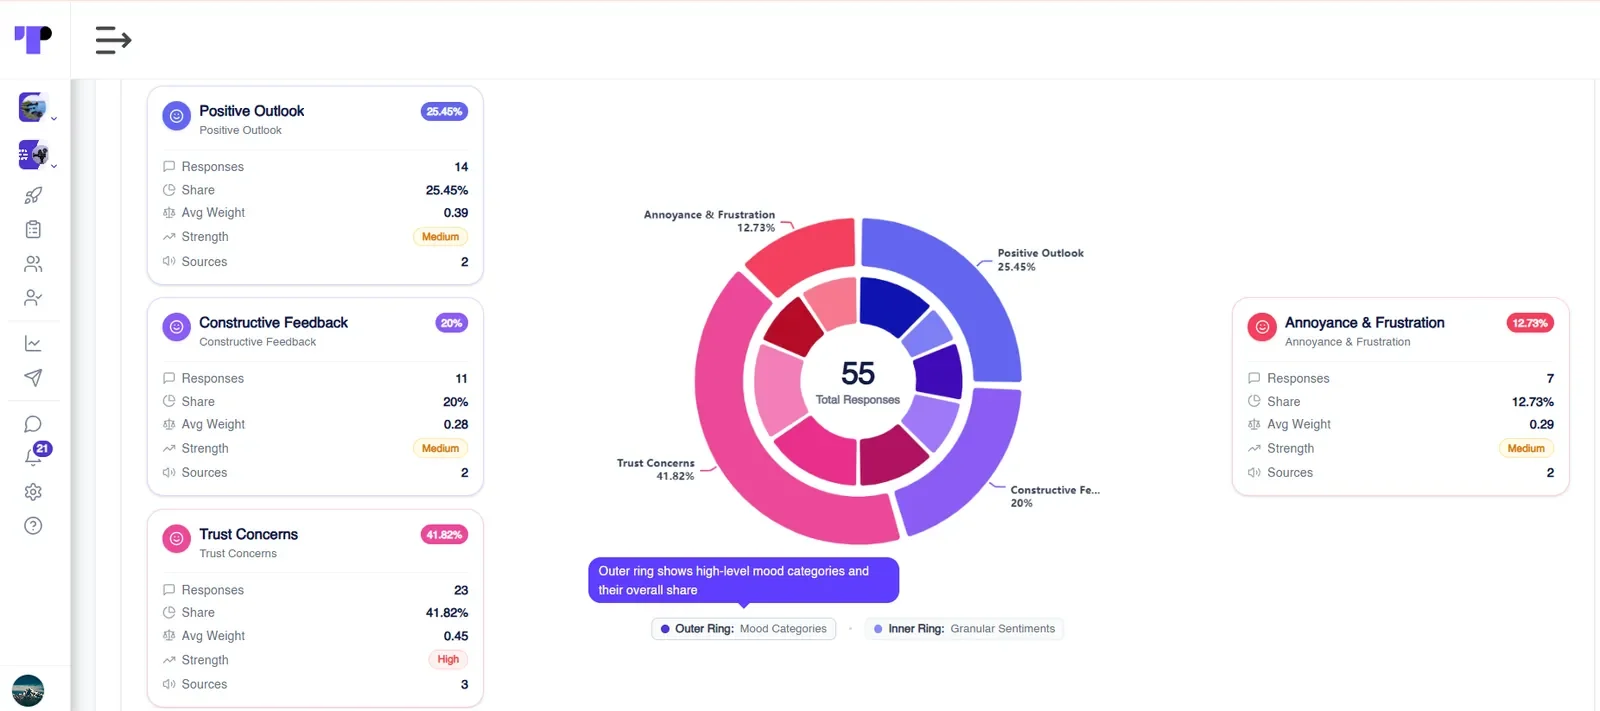
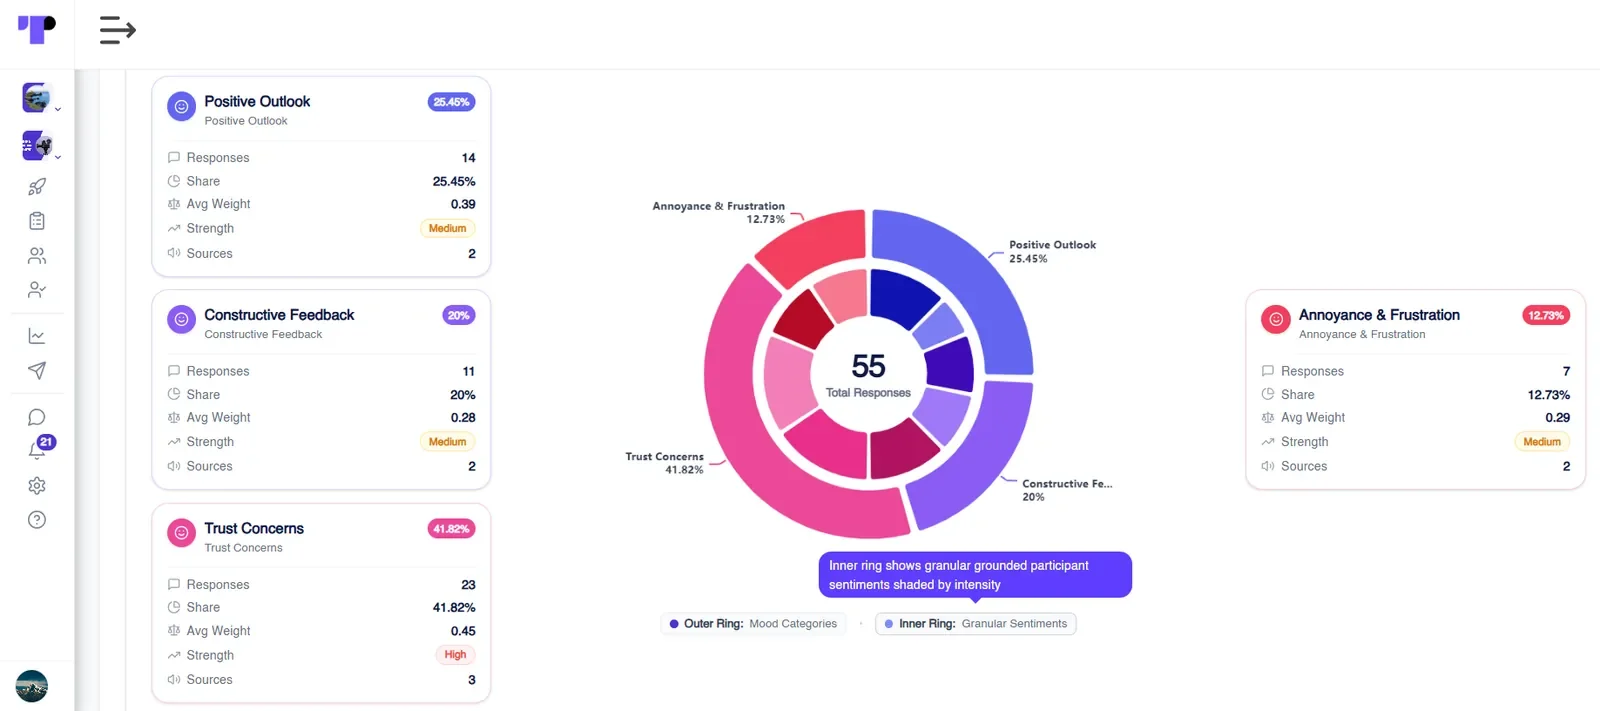
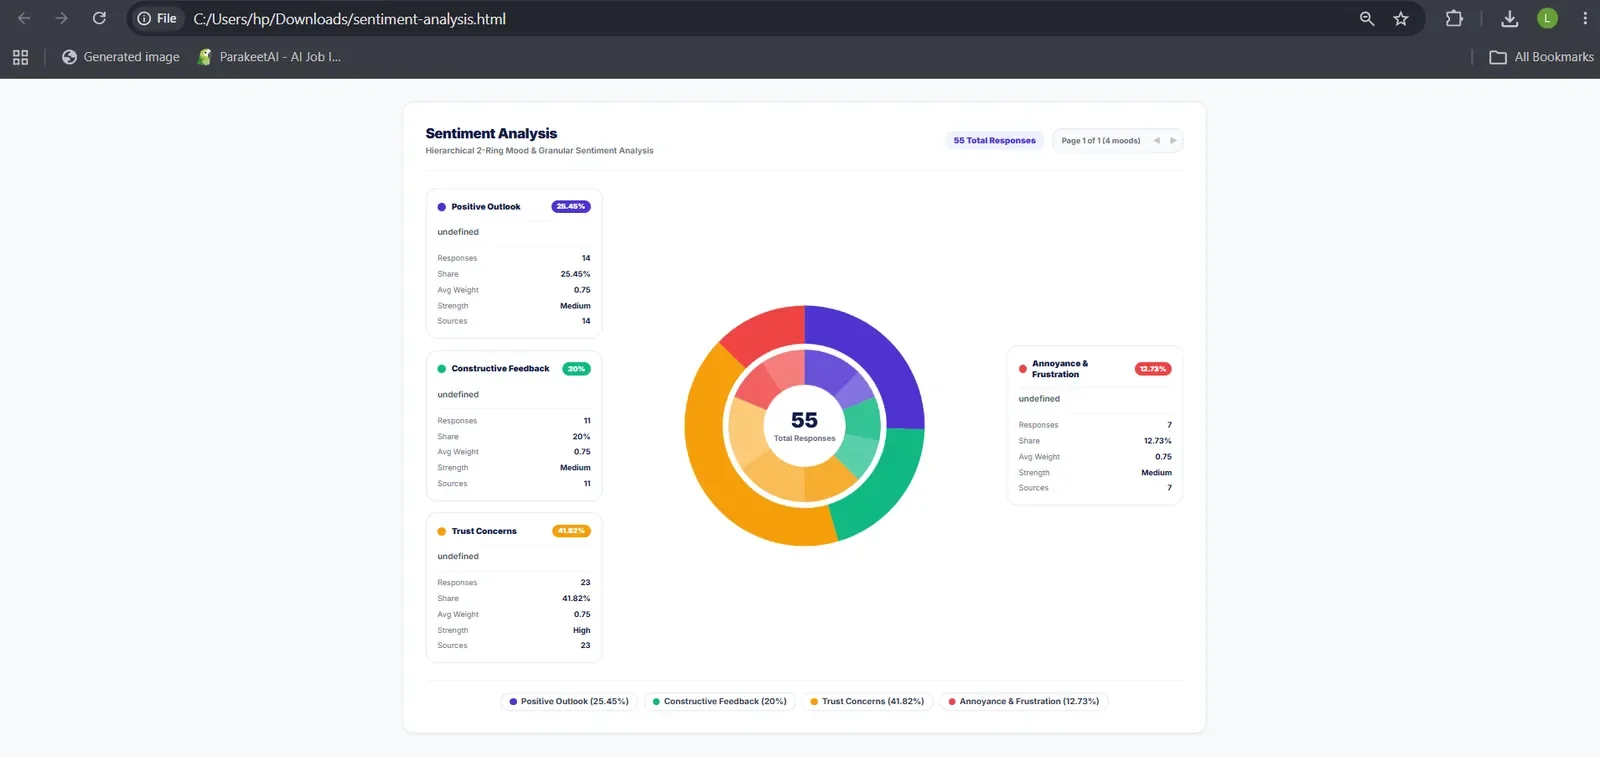
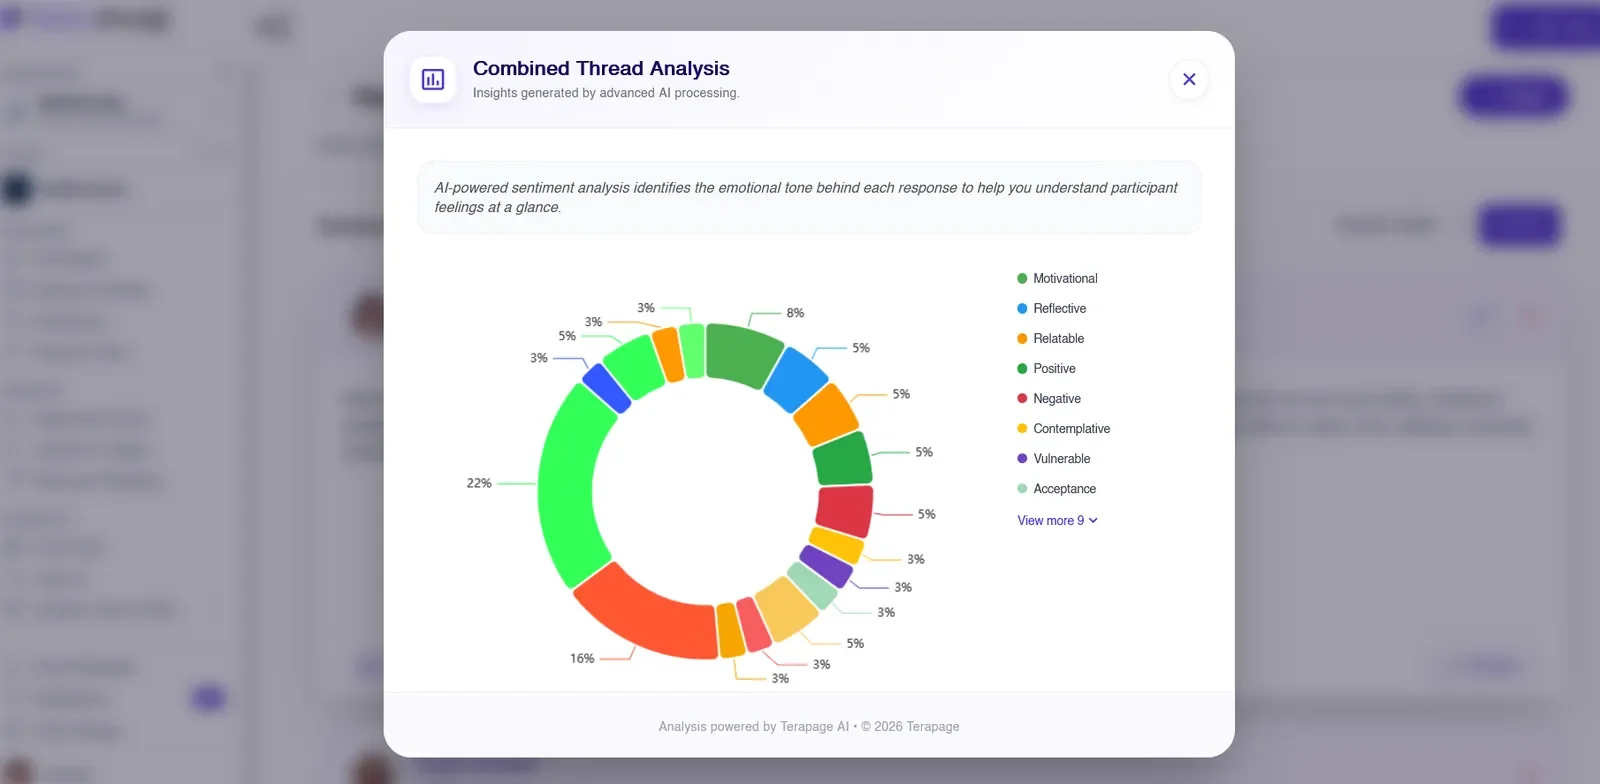
Once responses are in, AI reads each one and identifies the emotions in it. On Terapage, results appear in a two-ring chart that shows the big picture and the detail together:
- Outer ring: high-level mood categories, such as positive outlook or trust concerns, and their overall share of responses.
- Inner ring: granular sentiments grounded in what participants actually said, shaded by intensity.
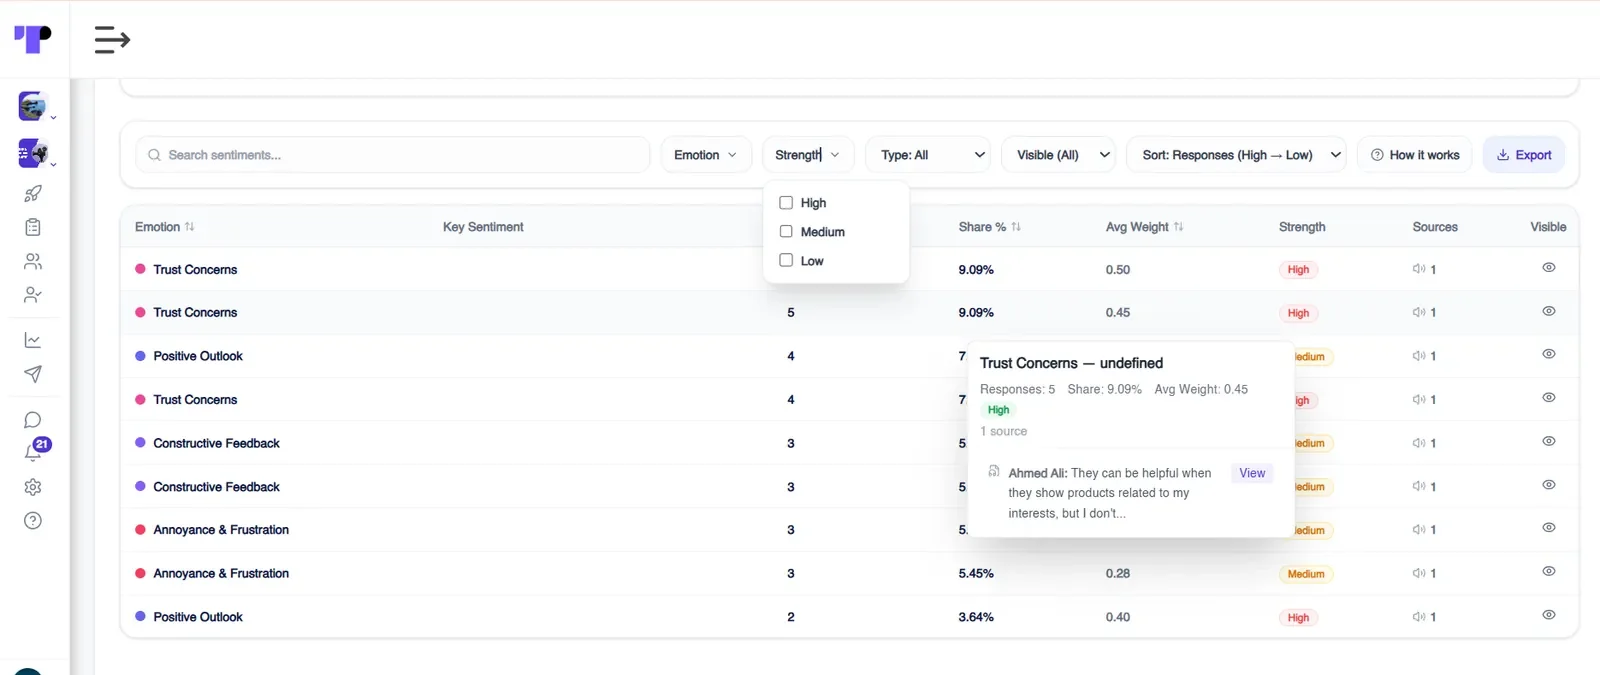
- Intensity: Terapage measures how strongly each feeling is expressed, not just whether it appears. Every mood shows its number of responses, share, average weight and a strength rating of high, medium or low.
Step 5: Check a Sample and Trace Results to the Source
AI-powered analysis is fast, but it can still make mistakes. Before you publish your results, read a few of the original responses behind each main feeling. Sarcasm, slang and cultural expressions are the most common sources of error, especially in multi-market studies.
Terapage makes this quick. In the sentiment table, hovering over any row shows the verbatim participant quote behind it, with a link to view it in the original transcript. Reading these quotes is the easiest way to check the AI got it right.
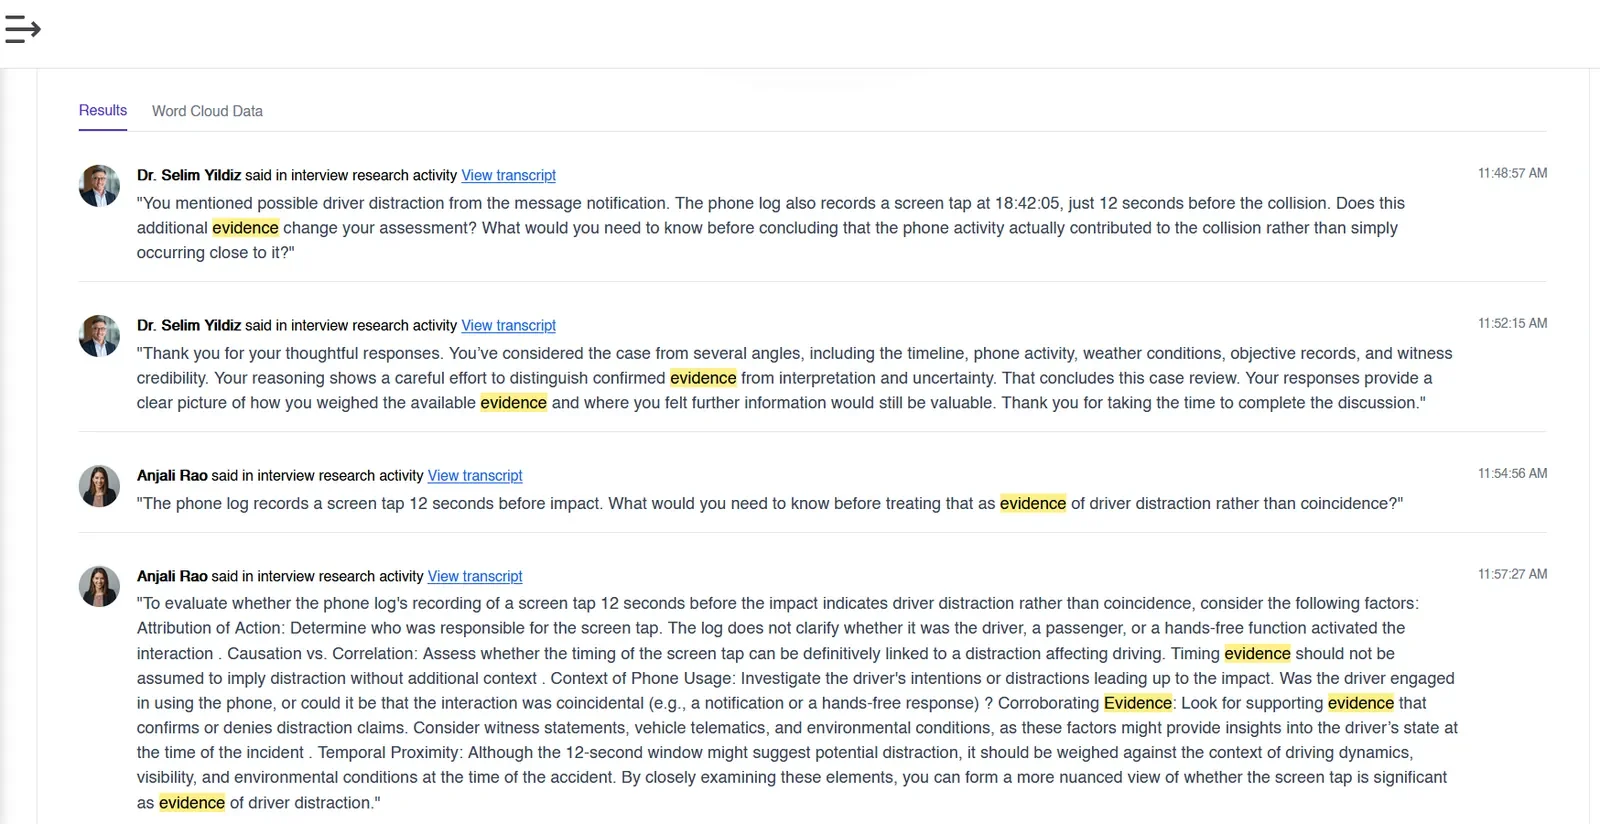
You can also search for a word and trace it back to the exact responses and transcripts where it appears, whether they came from live interviews, AI-moderated interviews or imported interviews. All of it sits within your reports and analysis workspace.
Step 6: Combine Sentiment With Themes and Segments
Sentiment is more useful when you know who feels what. Break results down by participant, group or market to see whether a feeling is widely shared or limited to a few people. Pair this with the themes your AI-powered insights uncover, and you'll know both what people talk about and how they feel about it.
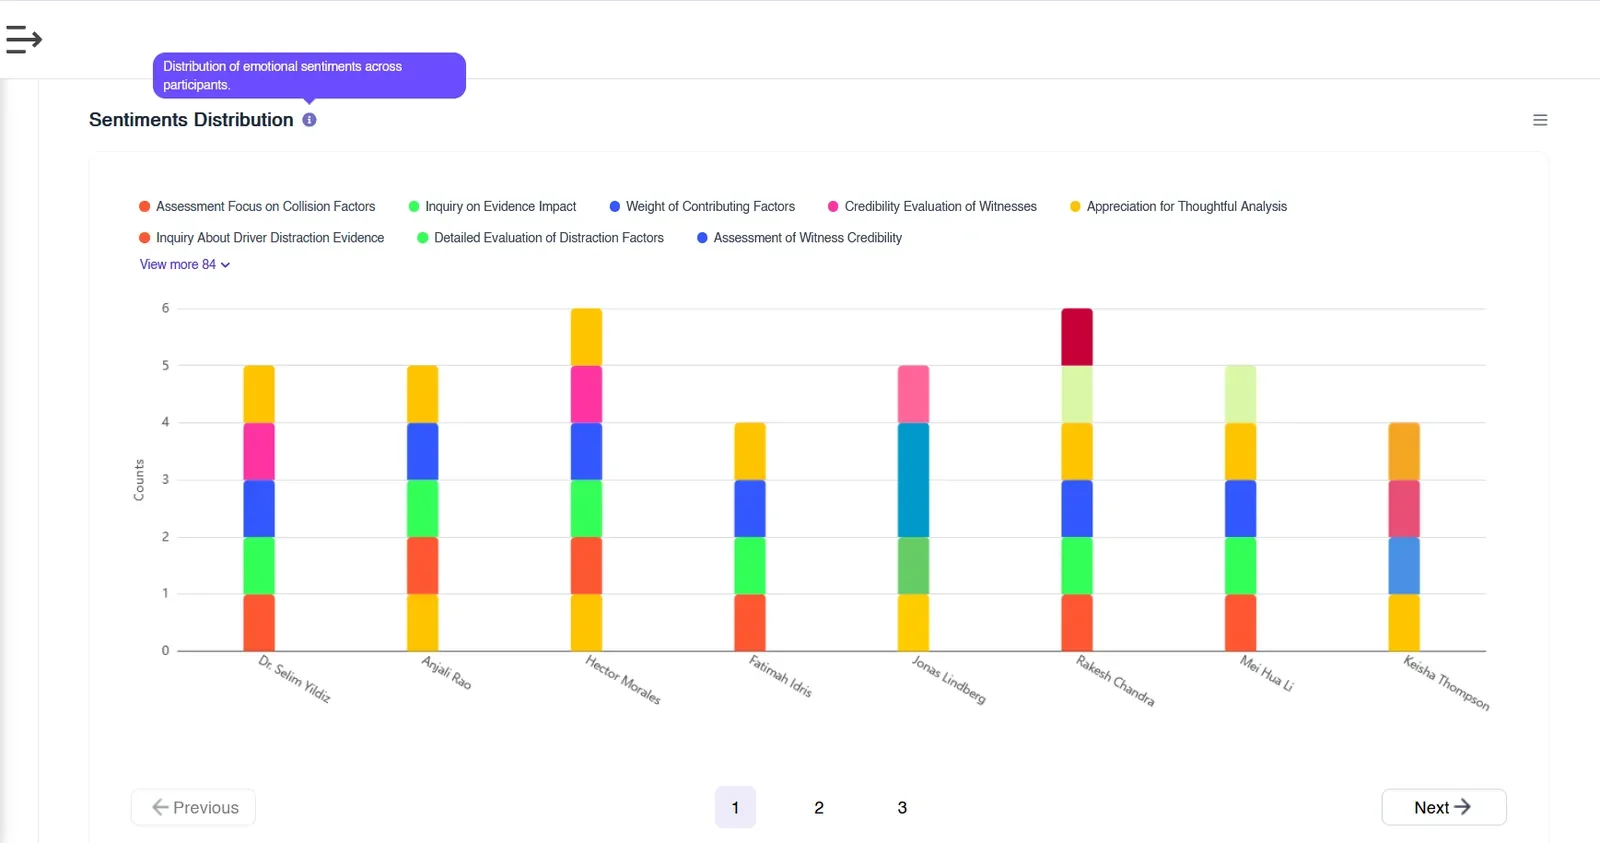
Step 7: Build AI Reports That Explain What the Sentiment Means
A chart full of emotions is a starting point, not a finding. Group similar feelings into broader patterns, explain what is driving them, and link them to a clear business decision. This turns qualitative insight and quantitative scores into one clear story.
When your findings are ready, export your sentiment results as CSV for deeper data analysis, PNG for presentations, or HTML for sharing online. You can also present them through reports and dashboards or turn them into branded insight reports your team can act on. If your team needs extra support interpreting results, Co-pilot Research Services can help with analysis and reporting.
What Are the Five Types of AI Sentiment Analysis?
There are five main types of sentiment analysis, and each one answers a slightly different question.
1. Polarity Sentiment Analysis
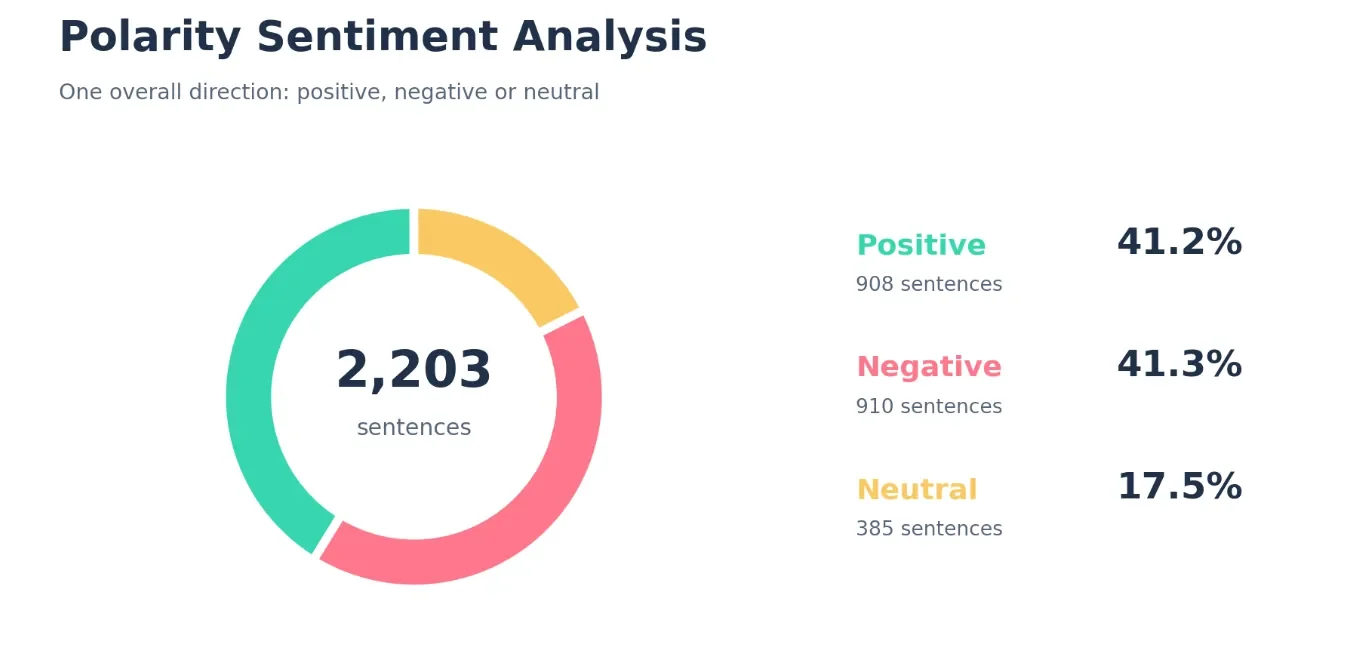
Polarity sentiment analysis is the simplest type. It sorts responses into positive, negative or neutral. In the example below, the two sides are almost equal, so you can see that opinion is divided, but not why.
2. Graded Sentiment Analysis
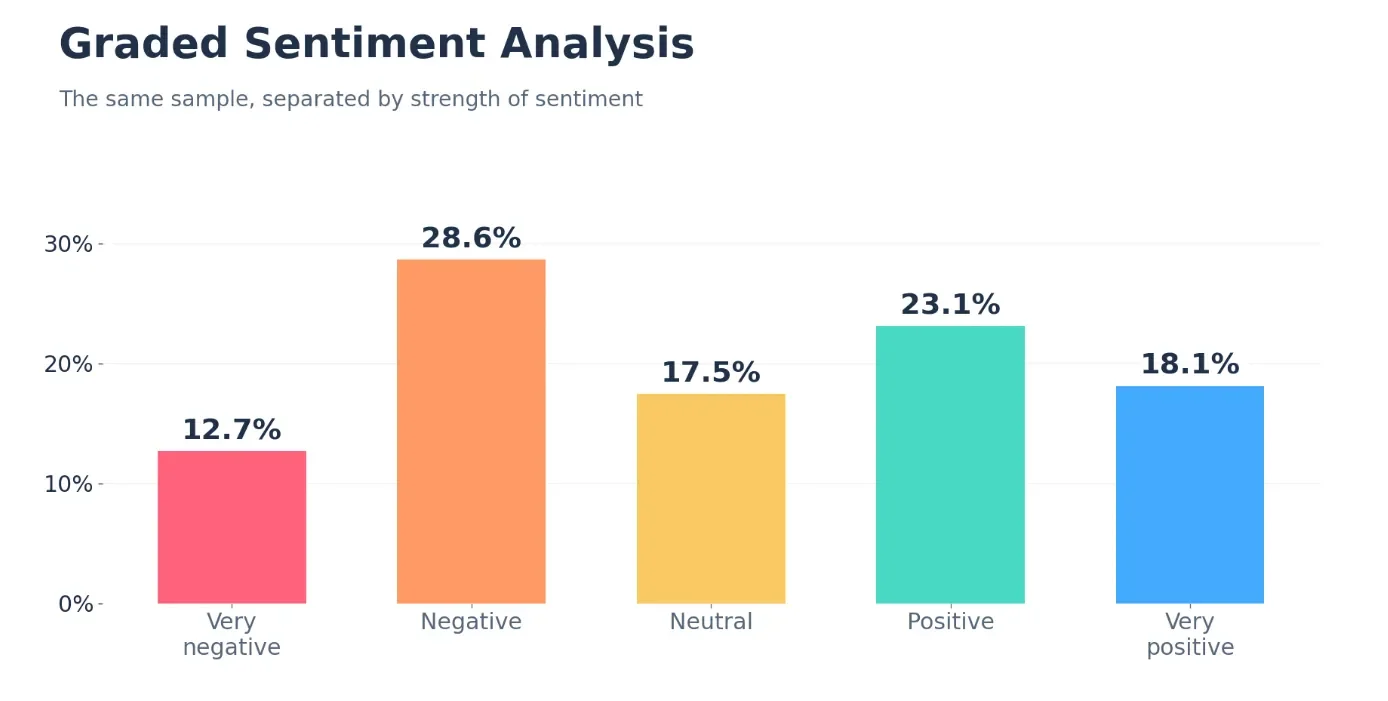
Graded sentiment analysis measures how strong a feeling is, not just whether it is positive or negative. It usually uses a five-point scale from very negative to very positive, so you can tell mild approval apart from strong enthusiasm.
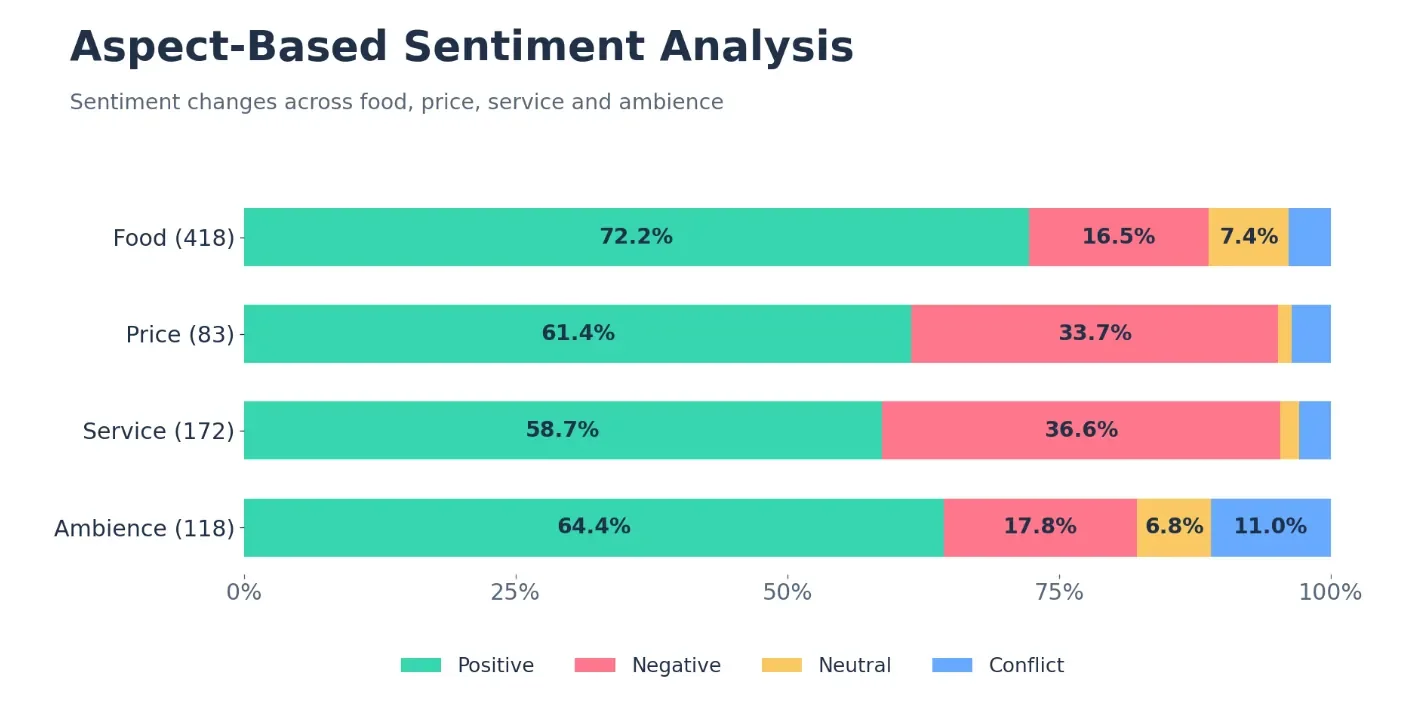
3. Aspect-Based Sentiment Analysis
Aspect-based sentiment analysis shows how people feel about specific parts of a product or experience. For example, a participant might love a product's texture but dislike its packaging. Aspect-based analysis keeps those two feelings separate instead of blending them into one score.
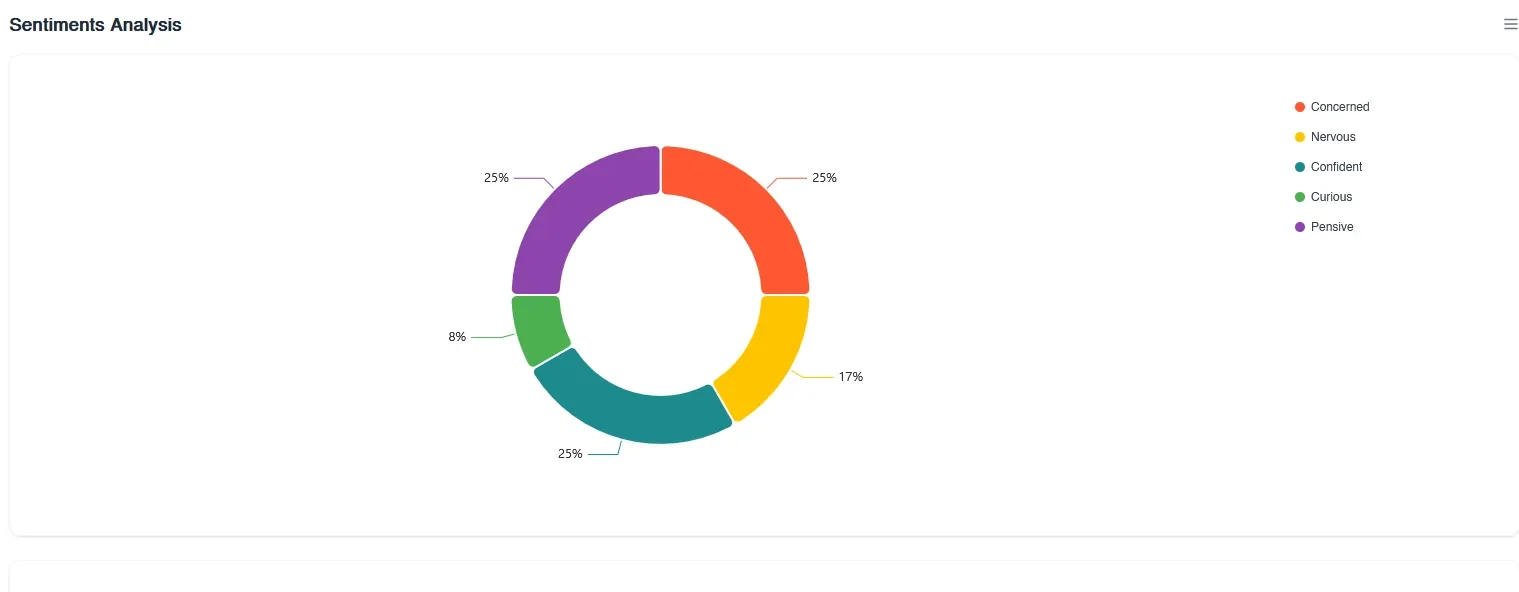
4. Emotion Detection
Emotion detection goes beyond positive and negative to name the actual feeling, such as concern, confidence or curiosity. This matters because two negative responses can mean very different things: a worried customer needs reassurance, while a frustrated one needs a fix.
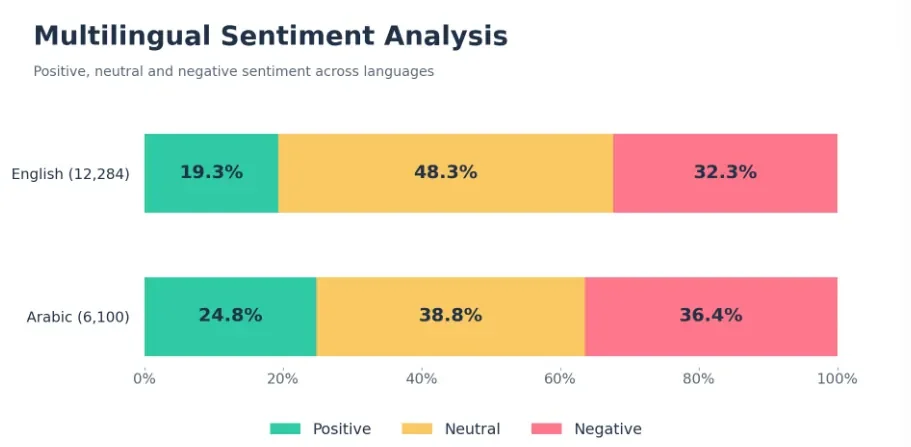
5. Multilingual Sentiment Analysis
Multilingual sentiment analysis reads emotion across different languages, which is essential for global studies. The same phrase can carry a different emotional weight in another culture, so the analysis needs context as well as translation.
Why Does Sentiment Matter in Market and Consumer Research?
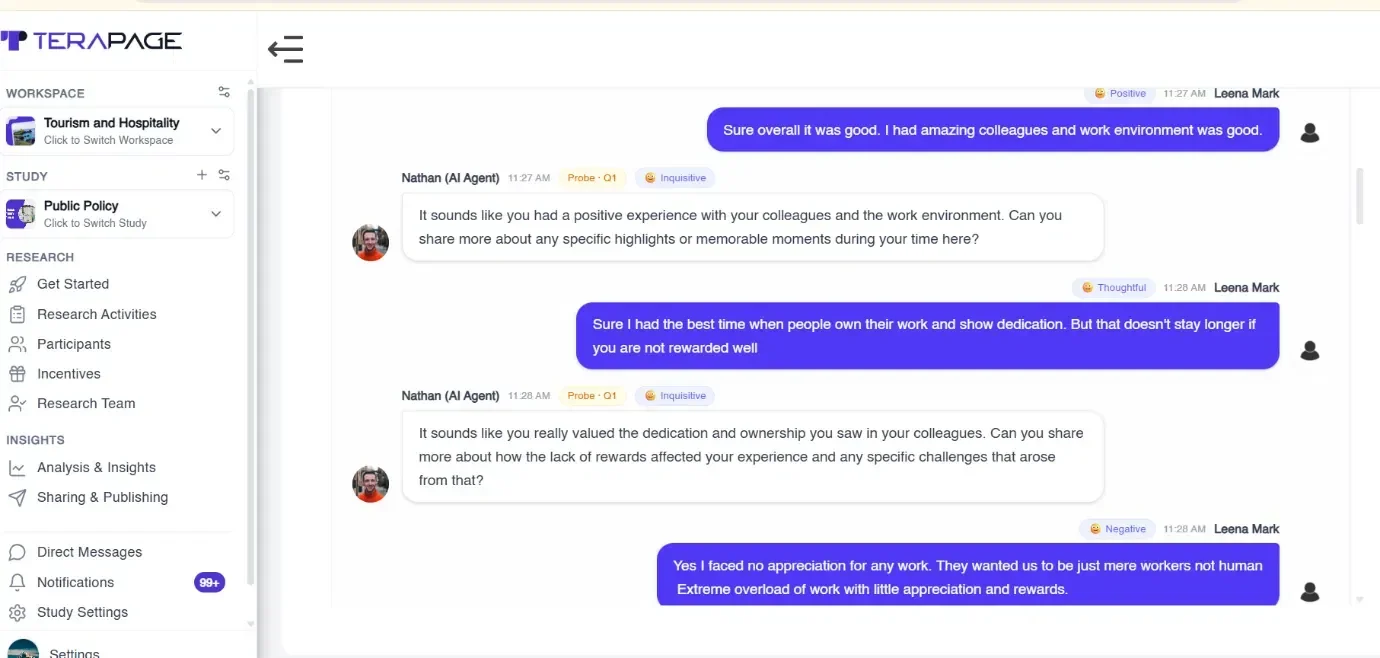
People rarely say what they feel at first. In the AI-moderated interview below, a participant first calls their experience good, then reveals frustration as the questions go deeper. A rating alone would have missed this.
Sentiment can also act as an early warning sign. Frustration often shows up in diary entries and open-ended answers long before it shows up in behaviour or results. Above all, sentiment explains the "why" behind what people do, which is what gives qualitative and quantitative research its depth. With AI-powered insights, researchers can spot these signals across every response, not just the few they have time to read.
How Does AI Sentiment Analysis Work in Qualitative Research?
In qualitative research, sentiment analysis reads the emotion inside rich, open-ended data and explains why people feel the way they do.
Where Does Qualitative Sentiment Data Come From?
Qualitative sentiment comes from any method where people share their thoughts freely. That includes:
- live video interviews
- online focus groups
- diary studies
- discussion boards
- document reviews
You can even import interviews run elsewhere and analyse them alongside new data.
Voice is one of the richest sources. In an AI-moderated voice interview, every answer is transcribed as the participant speaks. A participant might describe how past products caused irritation and dryness, then how a new product left their skin feeling hydrated. Sentiment analysis captures both the frustration and the relief in a single conversation.

How Does AI Read Tone, Context and Themes Together?
Qualitative data is rich but messy. A single answer can hold mixed feelings, and tone shifts as participants react to each other or think more deeply. Good analysis captures that nuance and links it to the topics people discuss: thematic analysis shows what participants talk about, while sentiment analysis shows how they feel about it.
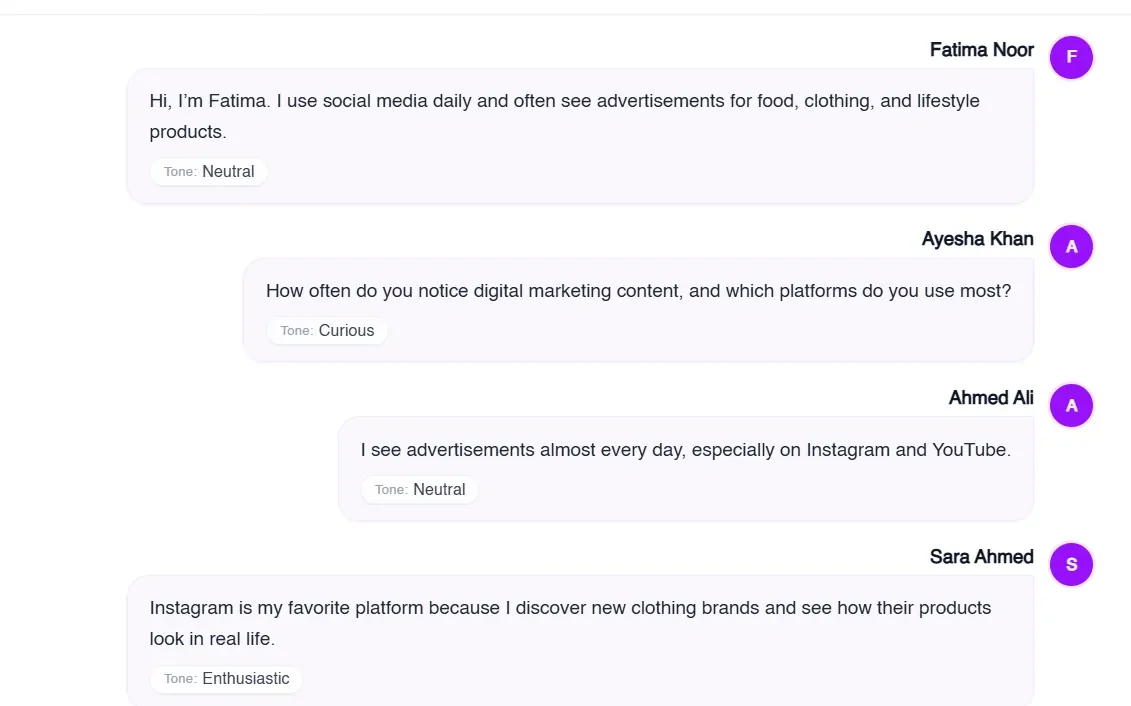
This is especially clear in an online group discussion. As participants build on each other’s views, AI tags the tone of every message, such as neutral, curious or enthusiastic, so you can see how the mood of the group shifts as the conversation develops.
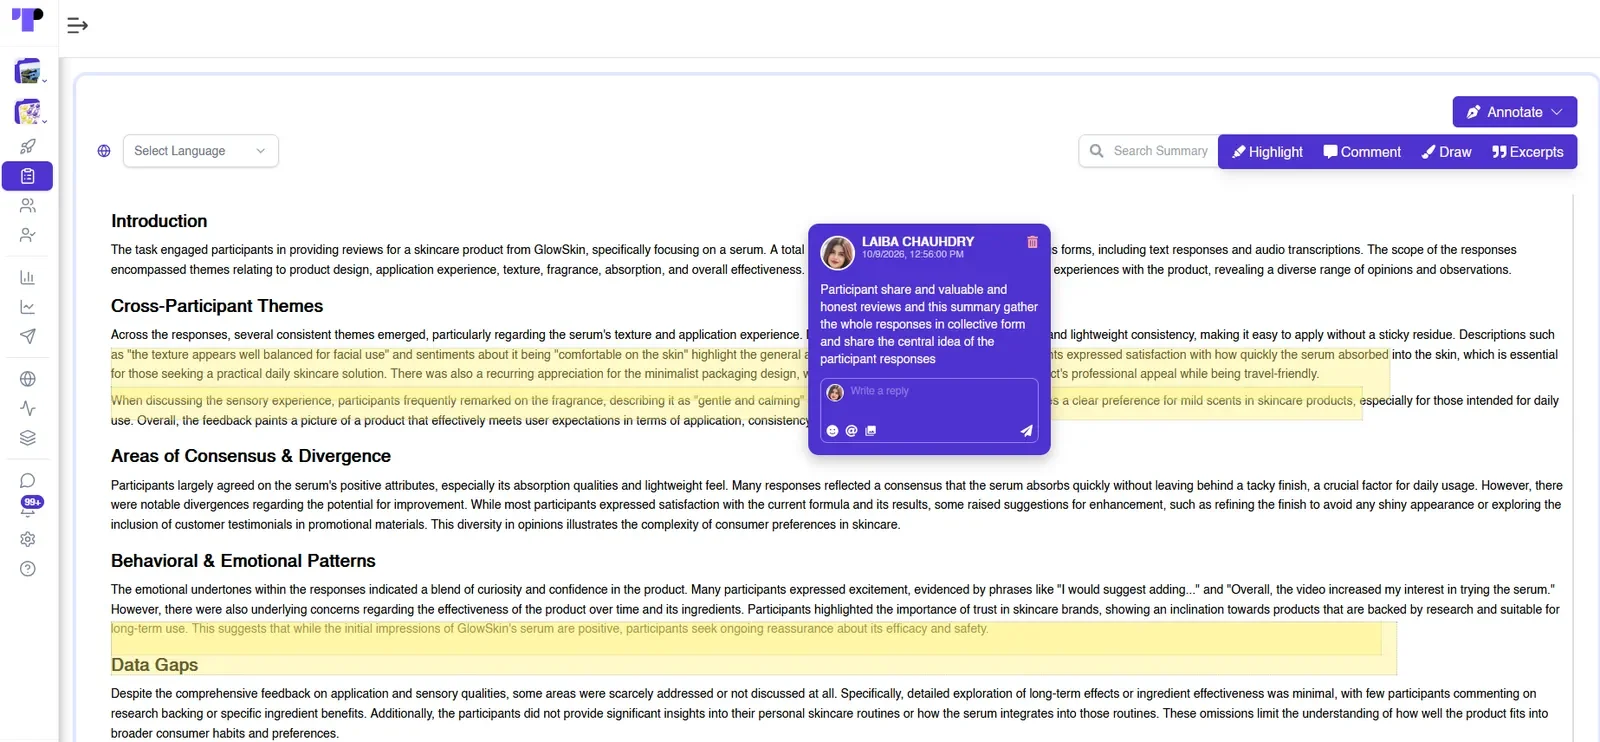
AI-powered summaries then turn the whole discussion into shared themes, areas of consensus and divergence, emotional patterns and data gaps. Researchers can highlight key passages, add comments for their team and save excerpts directly on the summary, an approach that works across research contexts from product testing to mock jury studies.
How Does AI Sentiment Analysis Work in Quantitative Research?
In quantitative research, sentiment analysis turns open text into measurable data that can be counted, compared and tracked at scale.
How Are Open-Ended Answers Turned Into Measurable Data?
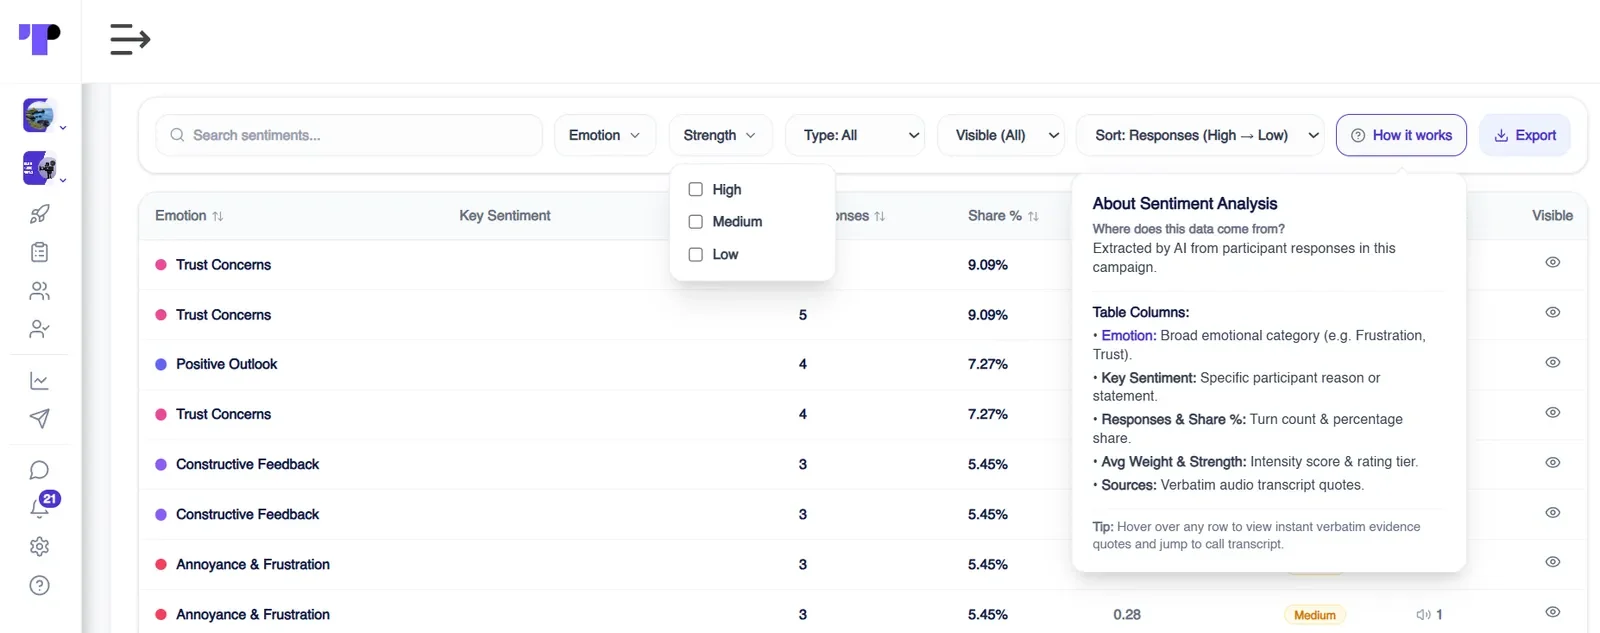
Sentiment scoring turns open-ended responses into numbers you can compare. In the AI analysis below, each emotion is listed with its number of responses, share of responses, average weight and strength. This is how Terapage measures intensity: the average weight scores how strongly a feeling is expressed, and the strength rating groups it as high, medium or low. You can filter by strength to focus on the most intense reactions, and every row links back to verbatim quotes. Across hundreds of responses, this shows which feelings are most widespread and most intense, so open answers can be analysed with the same rigour as a closed question.
How Does Sentiment Pair With Polls, Ratings and Scales?
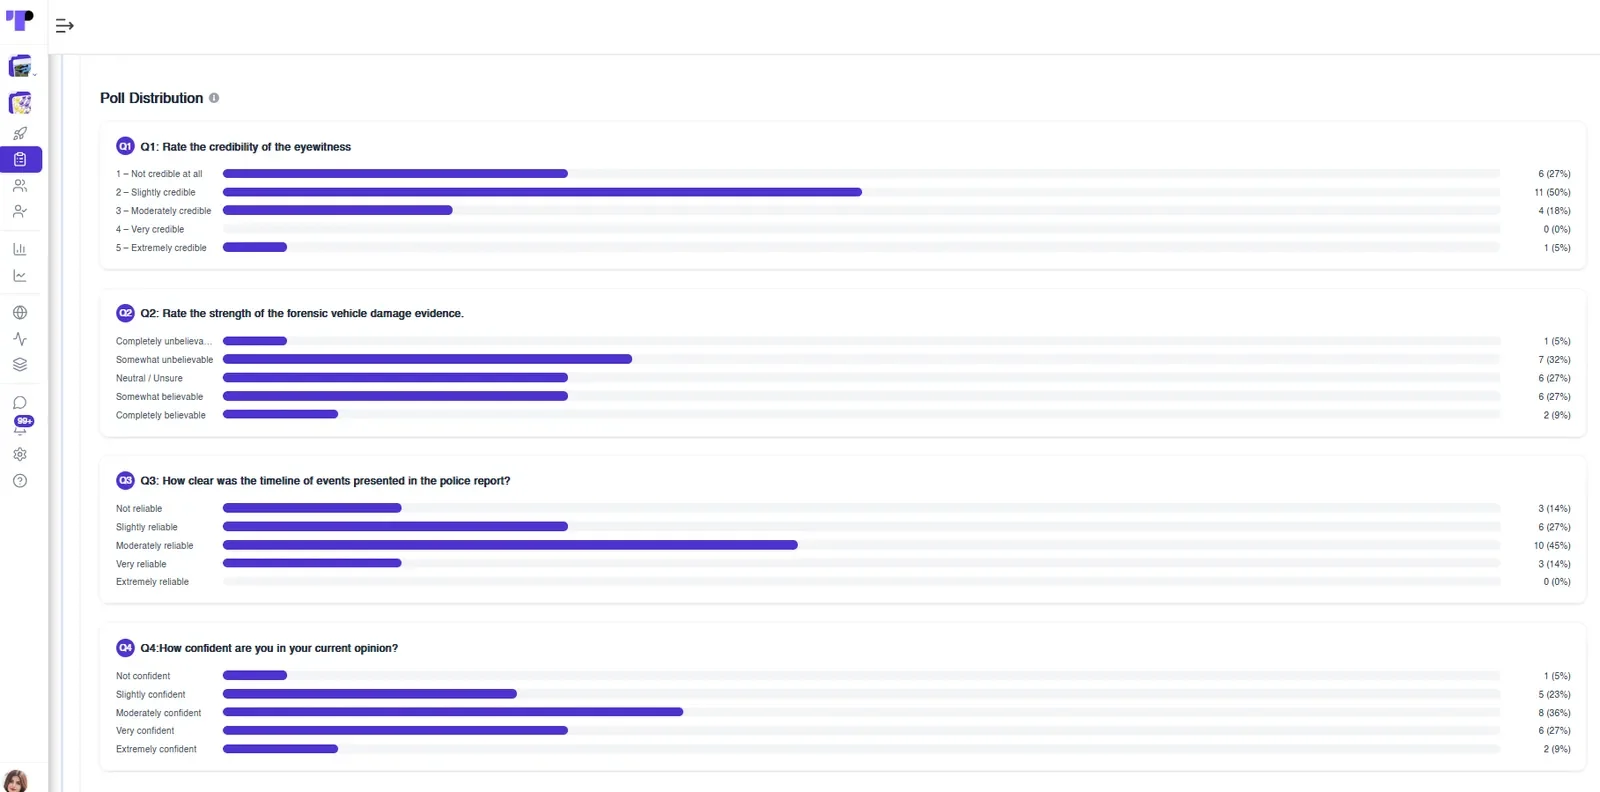
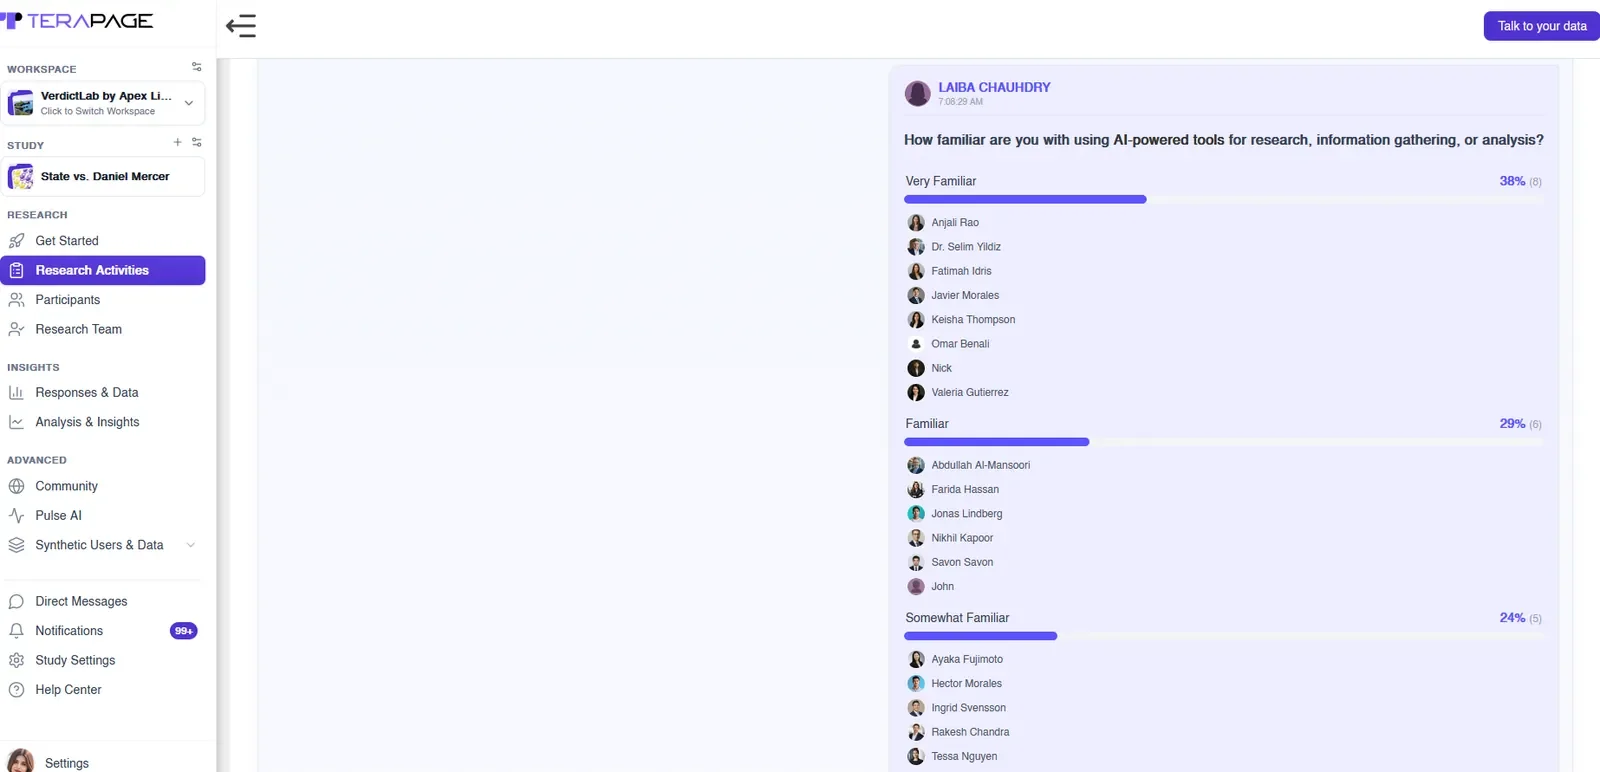
Ratings tell you what people chose. Sentiment tells you whether they meant it. When a poll, rating scale or matrix question sits beside an open response, you can spot contradictions, such as a high score paired with hesitant feedback. Polls can also show exactly which participants chose each answer, so you can read each person’s open response alongside the option they picked.
How Do You Track Sentiment Over Time and Across Segments?
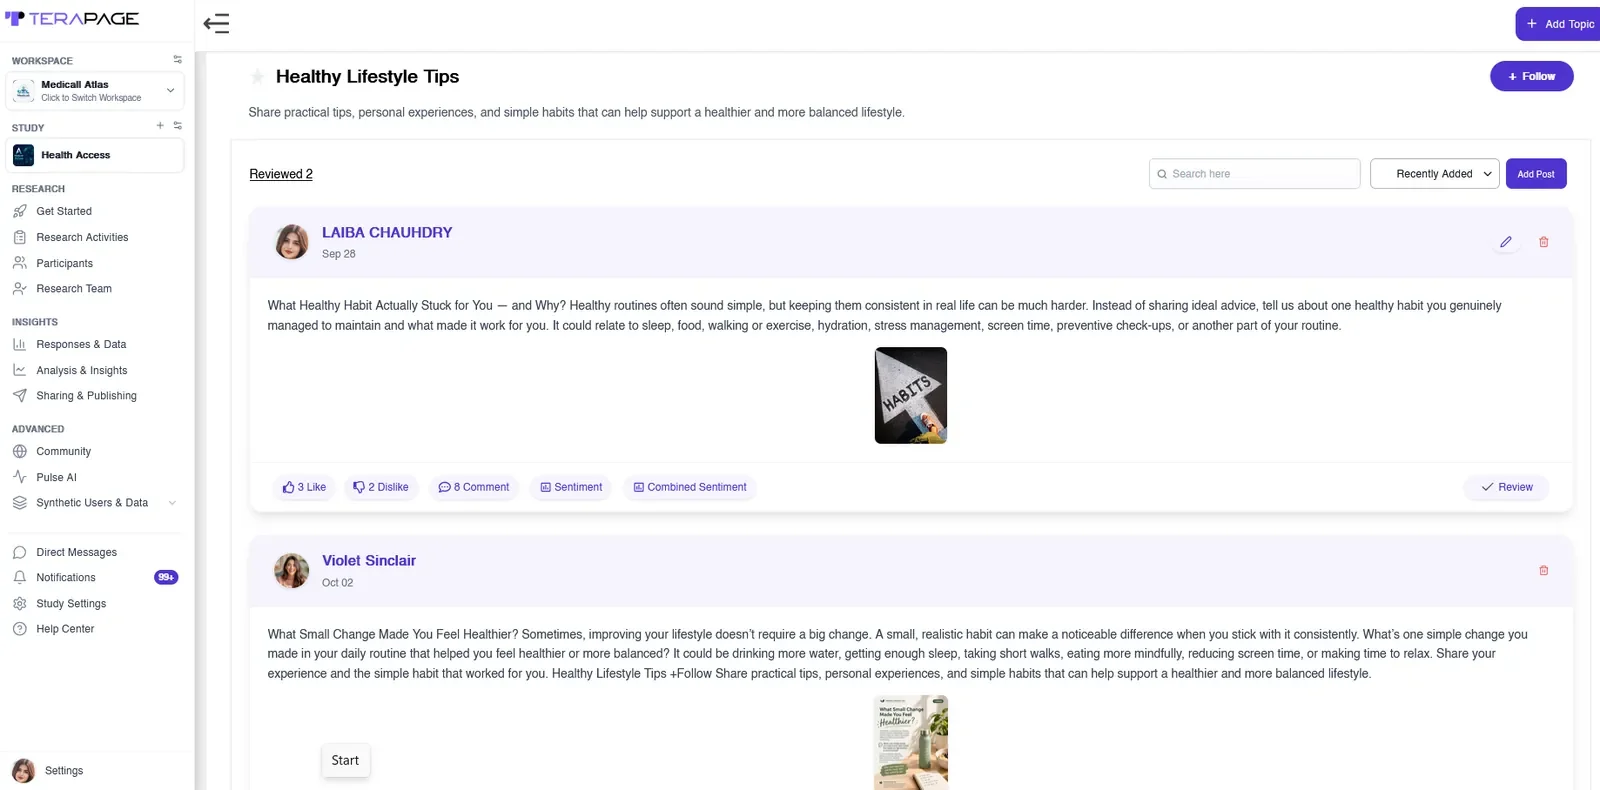
A single snapshot shows how people feel today. Tracking sentiment across diary entries, study waves or an always-on insight community shows how those feelings change after a launch, a campaign or a product update. Cross-project data comparison makes it possible to set one wave of research beside another, and comparing segments shows whether one market or age group reacts differently from the rest. With hybrid research, live sessions and ongoing community activities can feed the same analysis, so sentiment can be followed across both.
What Is the Difference Between Qualitative and Quantitative Sentiment Analysis?
The key difference is depth versus scale: qualitative sentiment analysis explains why people feel something, while quantitative sentiment analysis shows how many people feel it.
Qualitative vs. quantitative sentiment analysis at a glance
Can AI Sentiment Analysis Work Across Languages?
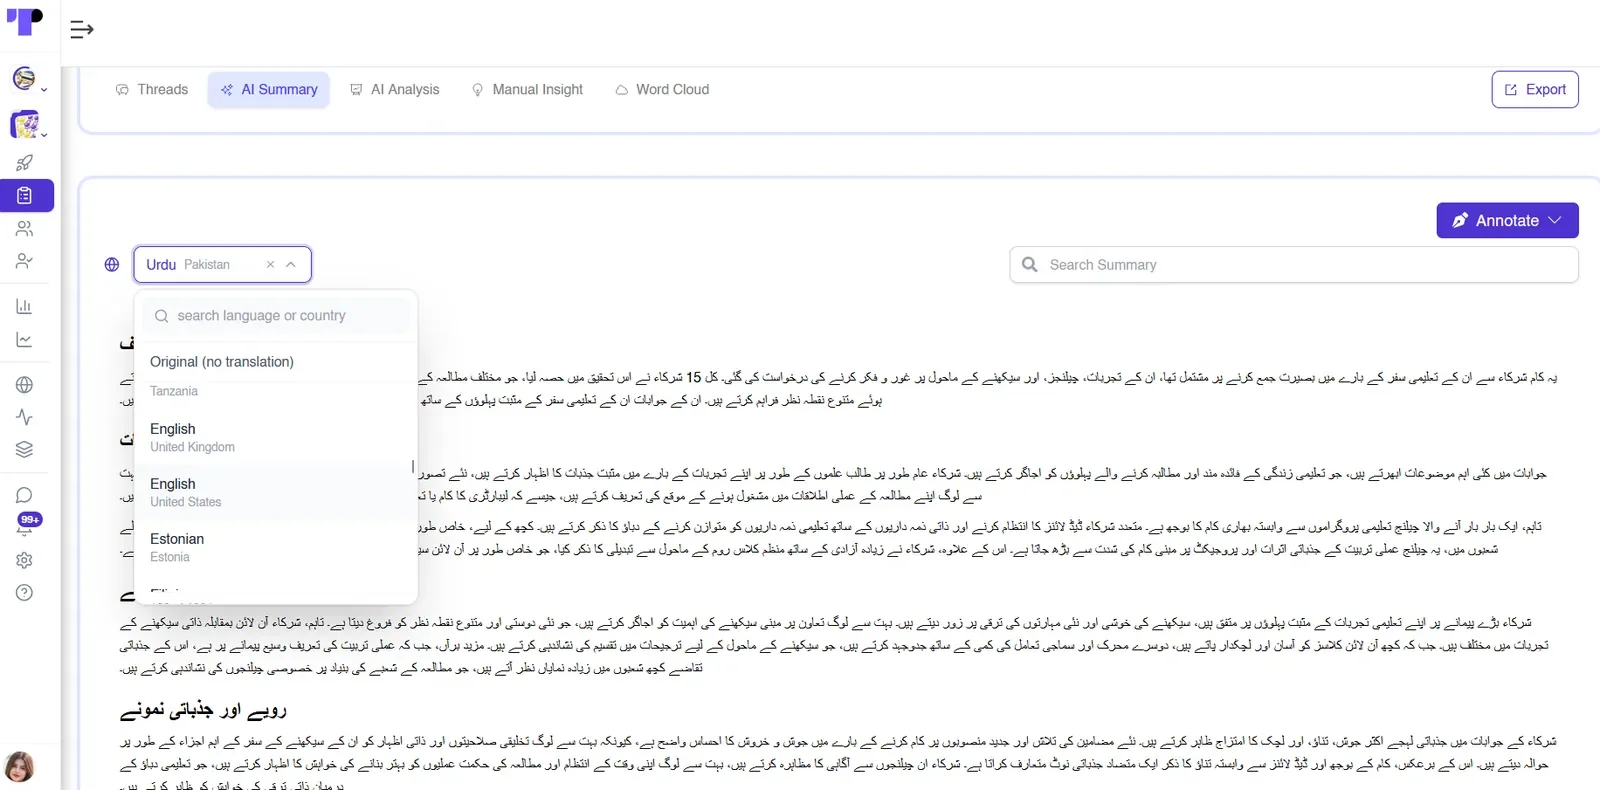
Global studies need more than one language. Terapage transcribes and translates responses across 26+ languages, so teams can read participant summaries in their own language while preserving the original responses for context.
One Platform for AI Sentiment Analysis, Reporting and Talking to Your Data
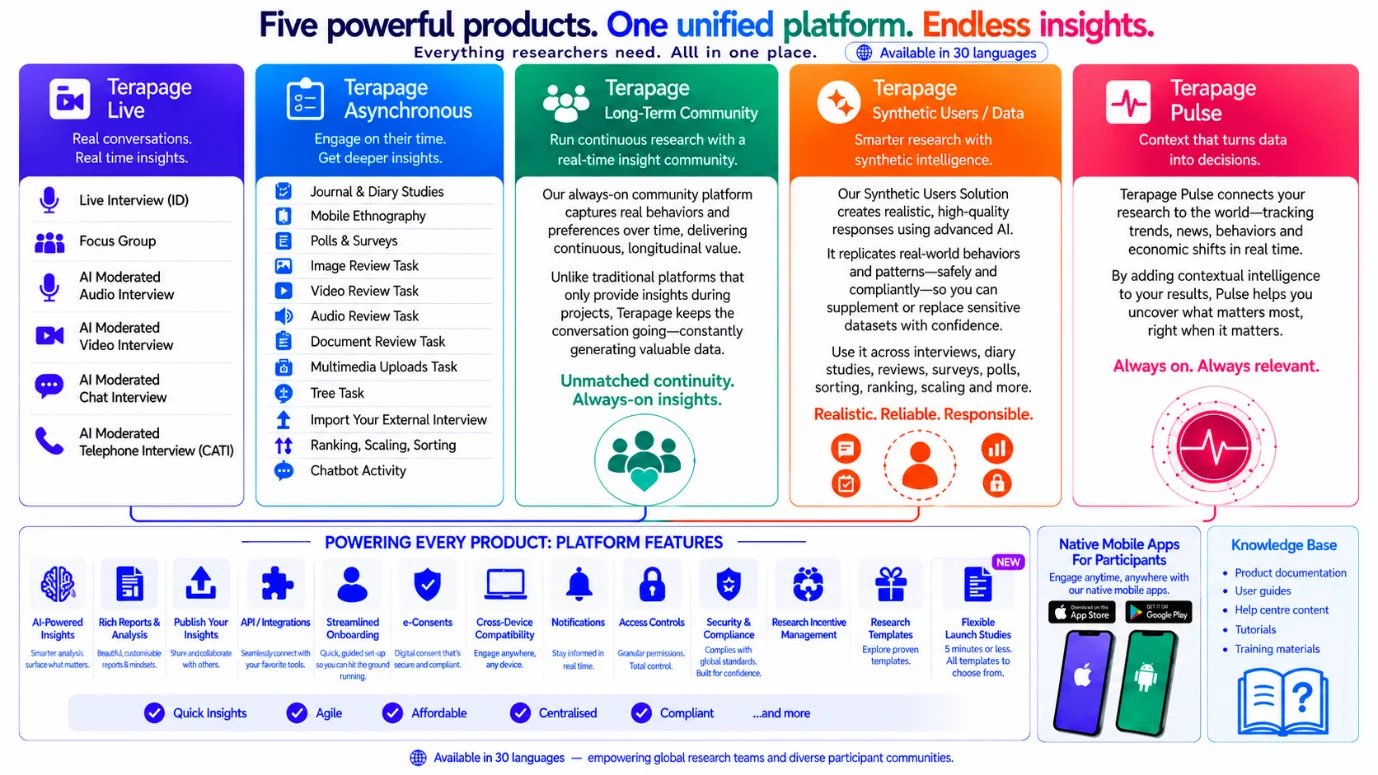
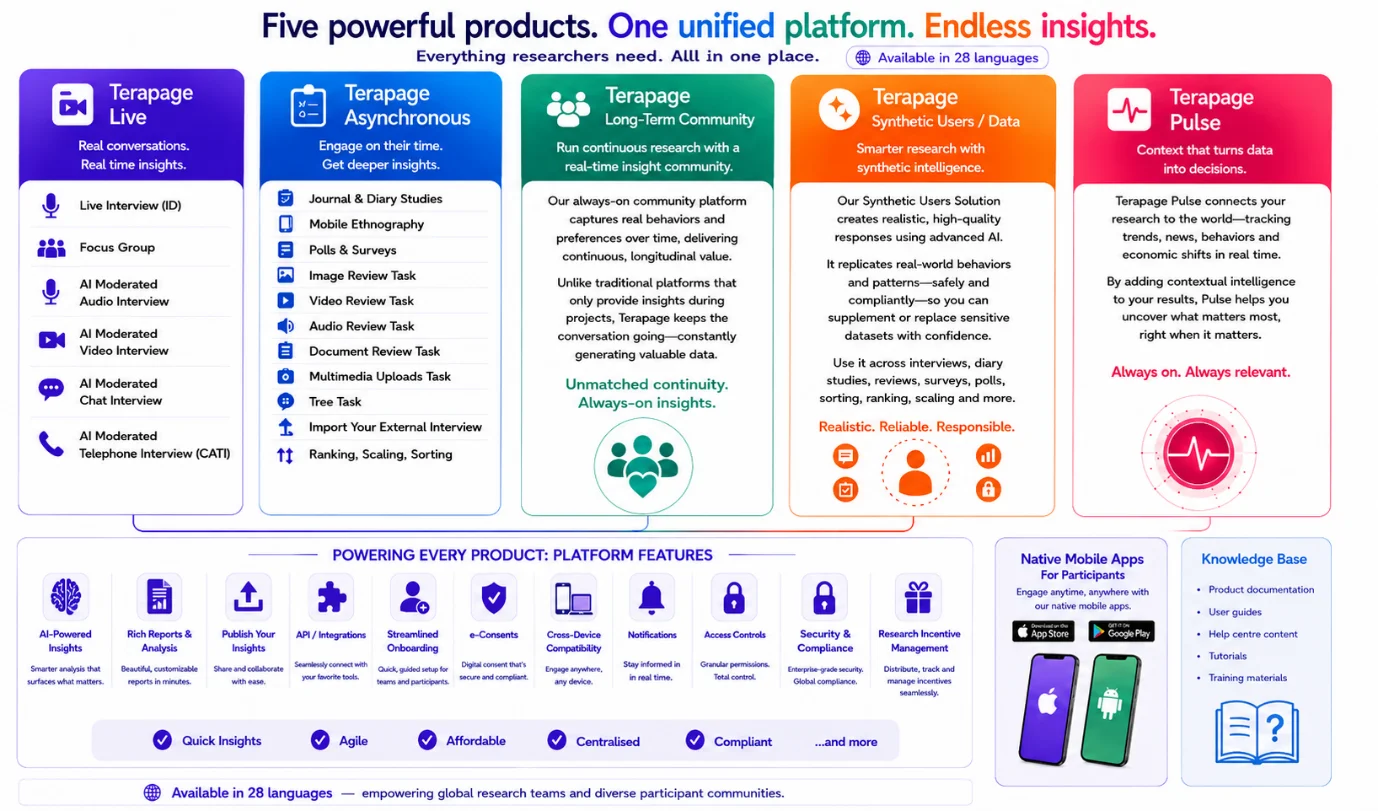
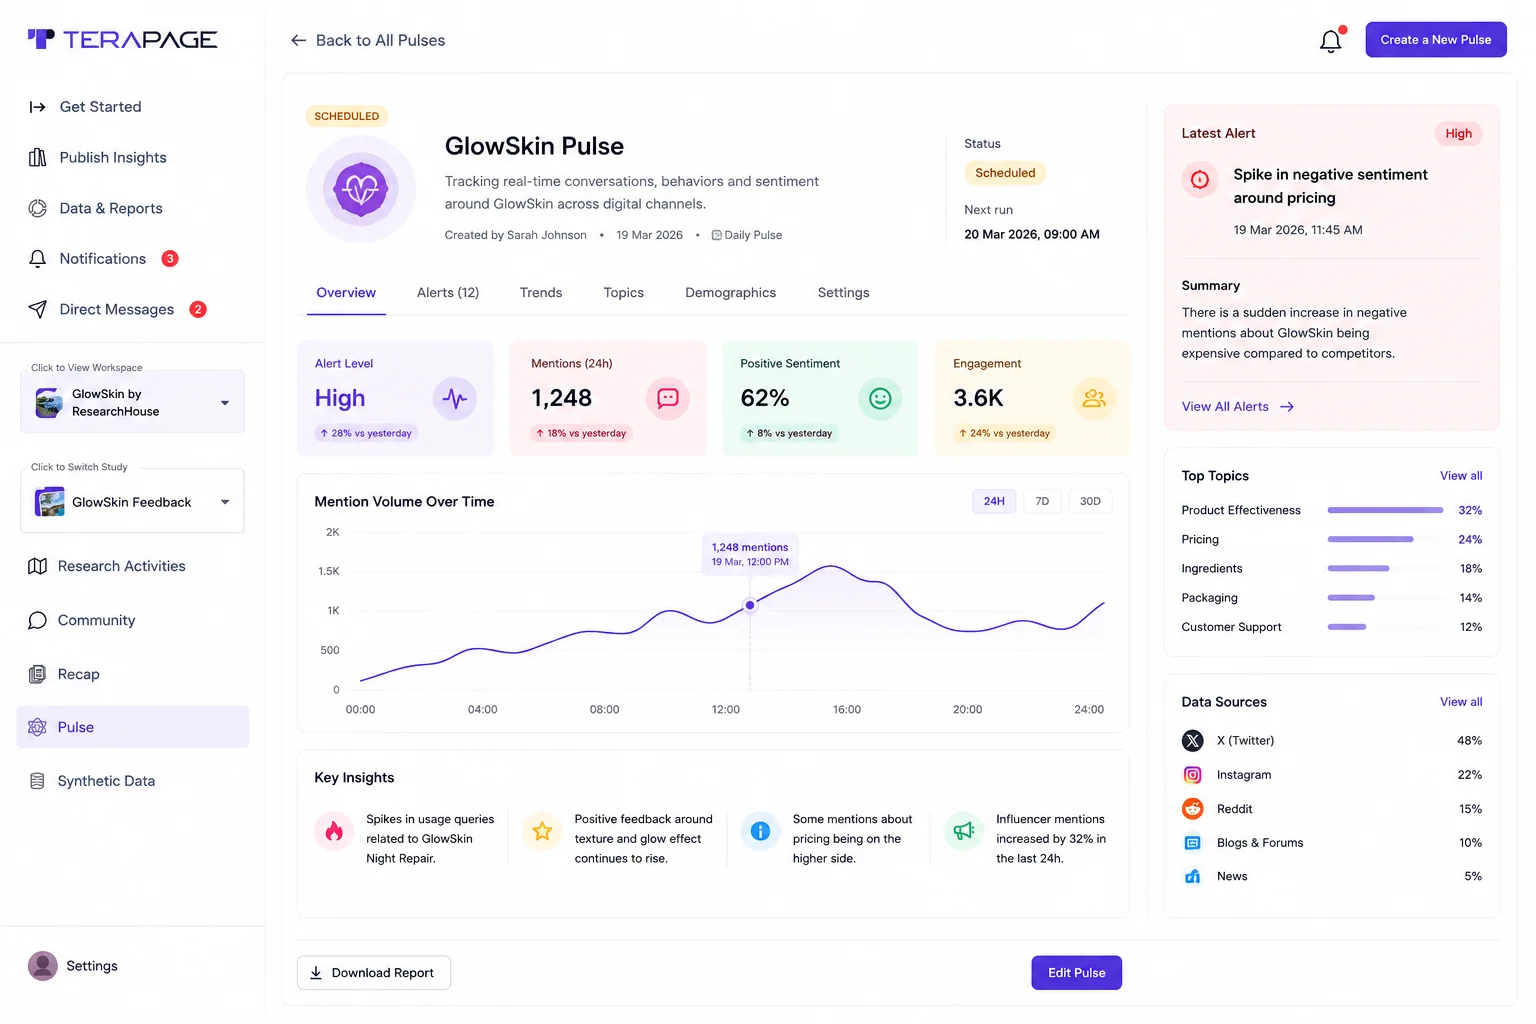
Terapage brings five research products together on one platform: live research, asynchronous research, long-term insight communities, synthetic users and data and Terapage Pulse. The same AI analysis and reporting runs across all of them. Emotions are measured the same way in every activity, researchers can ask their data questions in plain language, and findings move straight into reports and dashboards. You can explore the full list of platform features, and API integrations connect findings to the tools your team already uses.
This supports almost every research context, from concept testing and UX research to employee engagement and mock jury studies. Research agencies and in-house teams use it in sectors such as consumer goods and services, healthcare and pharmaceuticals and technology, media and telecoms. In each case, the value is the same: understanding not only what people decide, but how they feel while deciding it.