 Sign up with Google
 Sign in with Zoho



Introduction
For many brands, Report a Violation (RAV) on Amazon is treated as a tactical task: find a fake listing, file a report, move on. In 2026, this reactive approach leaves significant value on the table. Every RAV case generates data—about which products are targeted, which sellers reappear, which evidence types succeed, and where counterfeiters operate beyond Amazon. Brands that systematically capture and analyse this data can transform enforcement from a cost centre into a strategic advantage.
This article outlines how brands can build a data‑driven anti‑counterfeit function in 2026. It covers what to track, how to structure case data, and how to use insights to prioritise SKUs, refine evidence, and inform product, marketing, and distribution decisions.
Why Data Matters in 2026 Enforcement
Counterfeit operations have become more adaptive and networked. Common patterns include:
- Repeat‑offender sellers who reappear under new names or on different marketplaces
- SKU‑specific targeting, where certain products are consistently counterfeited due to margins or demand
- Seasonal spikes aligned with promotions, holidays, or new launches
- Channel displacement, where enforcement on Amazon pushes fakes to domains, social, or other platforms
Without structured data, brands respond to each incident in isolation. With data, they can identify patterns, anticipate risks, and allocate resources where they matter most.
Step 1: Define the Minimum Viable Data Set
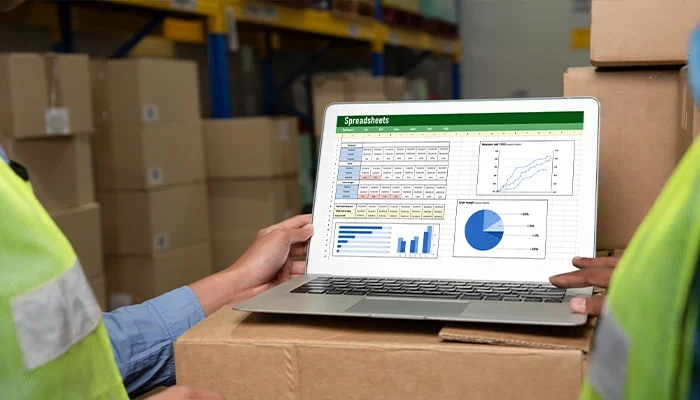
You do not need a complex system to start. A simple spreadsheet can capture the essentials. For each RAV case, record:
- Date filed
- Channel (e.g., Amazon US, Amazon EU)
- ASIN and product name
- Seller name/storefront
- Violation type (trademark counterfeit, copyright, etc.)
- Outcome (accepted, rejected, no action, listing removed, seller suspended)
- Reappearance (yes/no; if yes, new ASIN/seller)
- Evidence type (screenshots only, test buy, side‑by‑side comparison, etc.)
Optionally, add:
- Reason for rejection (if provided by Amazon)
- Notes (e.g., “seller linked to previous case #123”, “fake packaging very close to genuine”)
This becomes your core enforcement dataset.
Step 2: Structure Data for Analysis, Not Just Filing
To make the data useful, structure it so you can answer key questions:
- Which SKUs are most targeted?Group cases by ASIN/product to identify high‑risk items.
- Group cases by ASIN/product to identify high‑risk items.
- Which sellers are repeat offenders?Group by seller name/storefront to spot networks.
- Group by seller name/storefront to spot networks.
- Which evidence types perform best?Compare acceptance rates by evidence type (screenshots only vs. test buy + comparison).
- Compare acceptance rates by evidence type (screenshots only vs. test buy + comparison).
- Where do counterfeits reappear?Track reappearance flags and note new ASINs, sellers, or channels.
- Track reappearance flags and note new ASINs, sellers, or channels.
Use simple filters or pivot tables to surface these insights monthly.
Step 3: Use Insights to Prioritise SKUs and Sellers
Once you have a few months of data, use it to prioritise:
- High‑risk SKUs: Products with frequent counterfeit reports or high reappearance rates should move to the top of your monitoring list.
- Repeat‑offender sellers: Cluster reports by seller account rather than individual listings to increase the chance of account‑level action.
- High‑impact evidence: If test buys or side‑by‑side comparisons consistently yield higher acceptance rates, standardise those templates for priority SKUs.
This data‑driven prioritisation ensures your limited enforcement bandwidth delivers maximum impact.
Step 4: Feed Enforcement Data into Product and Marketing Decisions
Enforcement data is not just for legal or IP teams. It can inform broader business decisions:
- Product design: If certain visual elements (logos, packaging colours) are consistently copied, consider adding harder‑to‑replicate features (holograms, unique textures, QR‑based authentication).
- Pricing and promotions: If counterfeit spikes correlate with specific promotions or price gaps, adjust strategies to reduce the profit incentive for fakes.
- Channel strategy: If particular regions or marketplaces show high infringement with low acceptance rates, reconsider distribution models or invest in local IP registrations.
By sharing enforcement insights with product, marketing, and sales teams, brands can reduce counterfeit risk at the source, not just at the listing level.
Step 5: Extend Data Beyond Amazon
To avoid a narrow, Amazon‑centric view, extend your data model to other channels:
- Add rows or separate tabs for:Other marketplaces (Flipkart, Mercado Libre, etc.)Domains and standalone sitesSocial commerce (Instagram Shops, Facebook Marketplace, etc.)
- Other marketplaces (Flipkart, Mercado Libre, etc.)
- Domains and standalone sites
- Social commerce (Instagram Shops, Facebook Marketplace, etc.)
- Use consistent fields (product/SKU, seller/site, violation type, outcome) so you can compare across channels.
This unified dataset helps you:
- Identify cross‑channel sellers operating on Amazon and other platforms
- Spot channel‑specific patterns (e.g., certain fakes more common on social vs. marketplaces)
- Prioritise network‑level actions over isolated takedowns
Step 6: Build Simple, Repeatable Reporting
To keep leadership engaged, turn raw data into simple, regular reports:
- Monthly enforcement summary:Total cases filed, acceptance rate, top 5 targeted SKUs, top 5 repeat sellers
- Total cases filed, acceptance rate, top 5 targeted SKUs, top 5 repeat sellers
- Quarterly trend analysis:Changes in infringement volume by category or regionCorrelation with launches, promotions, or seasonal peaks
- Changes in infringement volume by category or region
- Correlation with launches, promotions, or seasonal peaks
- Ad‑hoc deep dives:Focused analysis on a specific high‑risk product line or seller network
- Focused analysis on a specific high‑risk product line or seller network
Use clear visuals (charts, tables) and plain‑language insights: “SKU X saw a 40% increase in counterfeit reports in Q2, primarily from sellers based in Region Y; recommendation: prioritise authentication features and targeted RAV campaigns.”
A Practical 60‑Day Data Foundations Plan
To operationalise this approach, consider a 60‑day sprint:
Days 1–15
- Define your minimum viable data fields for RAV cases
- Set up a central spreadsheet or simple database for enforcement data
- Train relevant team members on consistent data entry
Days 16–45
- Begin systematic logging of all new RAV cases and outcomes
- Start tagging reappearance and linking related cases (same seller, same product)
- Run your first simple analysis: top 5 targeted SKUs and sellers
Days 46–60
- Create your first monthly enforcement summary report
- Share insights with product, marketing, and distribution teams
- Adjust evidence templates and monitoring priorities based on initial findings
By the end of this period, most brands will have a functioning data foundation that turns enforcement from reactive to strategic.
Final Thought
In 2026, the brands that win against counterfeits are not just those that file the most reports, but those that learn the most from them. By treating RAV cases as data points, structuring that information for analysis, and feeding insights back into product, marketing, and channel strategy, brands can disrupt counterfeit networks more effectively and reduce risk at the source.
For a detailed view of Amazon’s 2026 counterfeit removal process and how to integrate it into a data‑driven enforcement function, read: How to Remove Counterfeit Listings from Amazon: The 2026 Process.