
At first glance, it looks like a collection of charts, numbers, projects, SKUs, and invoices. But once you understand what each section tells you, the dashboard becomes one of the most valuable tools for keeping cloud costs under control.
Whether you're a developer, DevOps engineer, startup founder, or someone responsible for cloud spending, knowing how to read your billing dashboard can help you spot unnecessary expenses before they become expensive surprises.
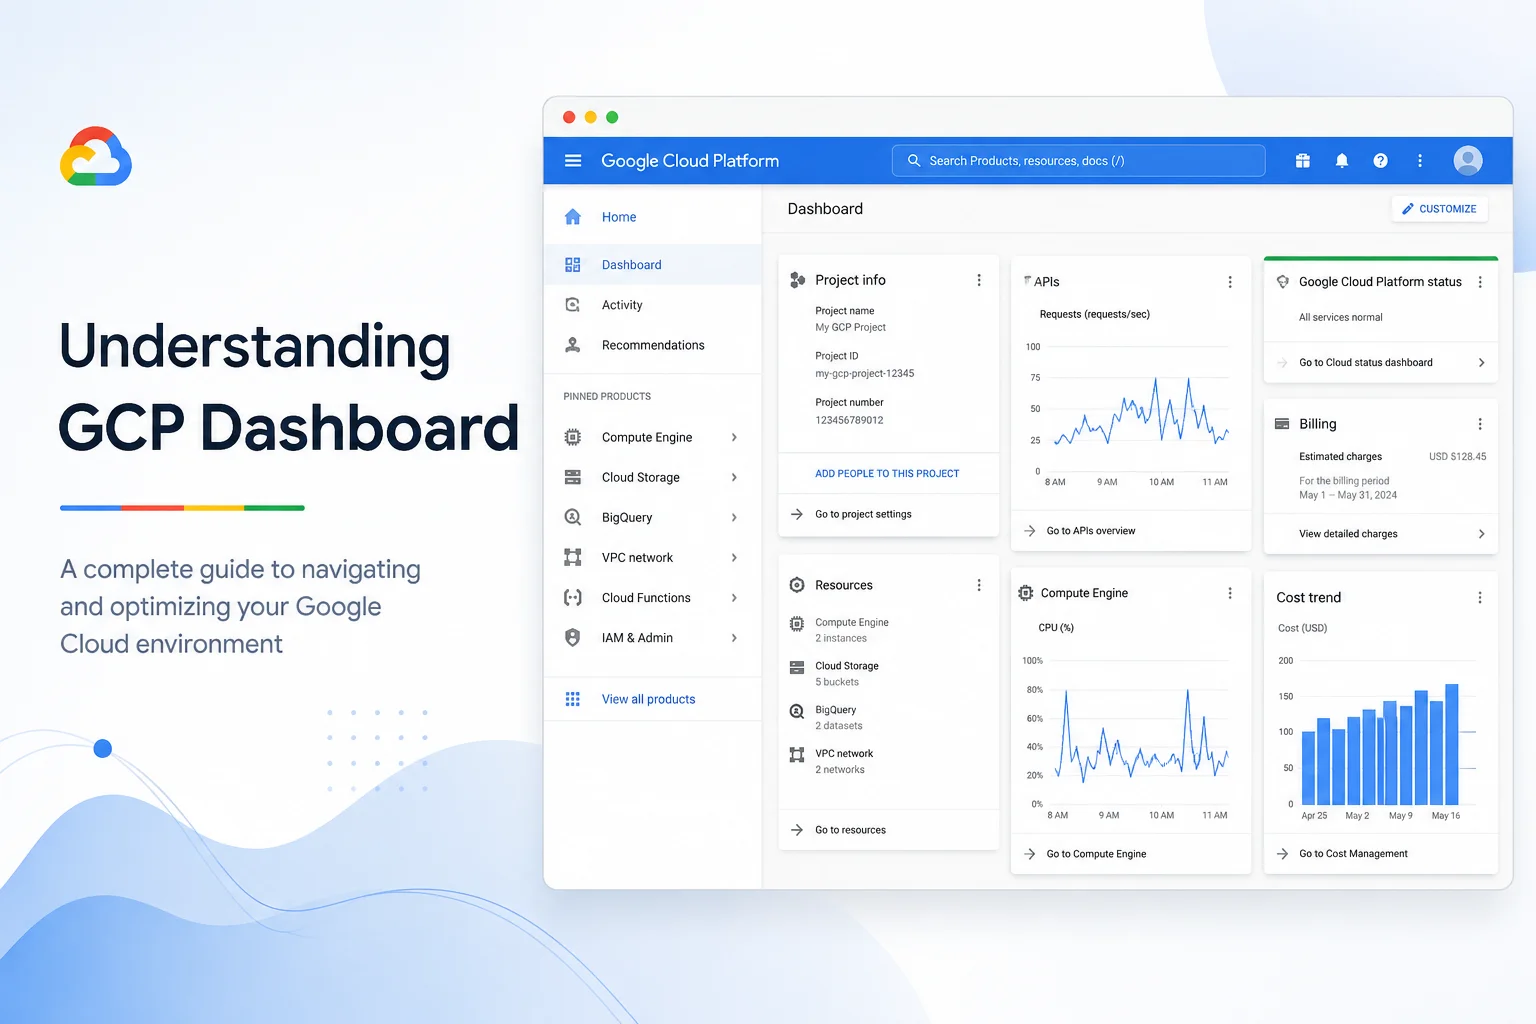
Let's walk through the dashboard step by step.
Why the Billing Dashboard Matters
Many teams only look at their cloud bill at the end of the month. By then, the money has already been spent.
The billing dashboard gives you visibility into where your cloud budget is going while you're still able to act. Instead of reacting to high invoices, you can identify unusual spending patterns, understand which services cost the most, and make informed decisions throughout the month.
Think of it as a financial health check for your cloud infrastructure.
The Cost Overview
The first thing you'll notice is the overall cost summary.
This section shows how much your organization has spent during a selected time period. You can switch between daily and monthly views to understand spending trends.
Here are a few questions worth asking:
- Did costs suddenly jump this week?
- Is spending steadily increasing?
- Are weekends significantly cheaper than weekdays?
- Does the trend match your application's usage?
Even a quick glance can reveal unusual behavior that deserves a closer look.
Breaking Down Costs by Service
One of the most useful sections is the service breakdown.
Instead of seeing one large bill, you'll see exactly how much you're paying for services like:
- Compute Engine
- Cloud Storage
- BigQuery
- Cloud SQL
- Google Kubernetes Engine (GKE)
- Networking
This makes it much easier to identify where most of your budget is going.
For example, if Compute Engine suddenly represents 70% of your monthly spending, it may be worth reviewing virtual machine sizes, uptime, or autoscaling settings.
Filter by Projects
Most organizations don't run everything inside a single Google Cloud project.
Development, testing, staging, and production environments are usually separated into different projects.
The billing dashboard lets you filter costs by project so you can answer questions like:
- Which application costs the most?
- Is our development environment becoming too expensive?
- Are temporary testing projects still consuming resources?
This simple filter often uncovers forgotten environments that continue running long after they're are no longer needed.
Understanding SKUs
This is the section that confuses many people.
A SKU represents a specific billable resource or pricing item.
Instead of showing only "Compute Engine," your bill may list separate charges for:
- Virtual machine usage
- SSD storage
- Snapshot storage
- Network traffic
- GPU usage
- Static IP addresses
Looking at costs at the SKU level helps you understand exactly what you're paying for instead of guessing.
Labels Help You Track Spending
Labels are one of the easiest ways to organize cloud costs.
By assigning labels such as:
- production
- development
- marketing
- analytics
- customer-a
you can group spending by team, department, application, or environment.
Without proper labels, cloud costs quickly become difficult to allocate across the business.
Look for Unexpected Cost Spikes
One of the best habits is comparing today's spending with previous weeks.
Ask yourself:
- Did someone deploy larger virtual machines?
- Was a forgotten testing cluster left running?
- Has data transfer increased unexpectedly?
- Are backup snapshots growing every day?
Finding these changes early is much easier than investigating a large invoice at month-end.
Don't Ignore Network Costs
Many teams focus only on compute resources.
However, networking charges can quietly grow over time.
Keep an eye on:
- Internet egress traffic
- Inter-region data transfer
- Load balancer costs
- VPN usage
These charges often surprise teams because they're less visible during day-to-day operations.
Use Budgets and Alerts
Monitoring costs manually isn't realistic for growing cloud environments.
Google Cloud allows you to create budgets and configure spending alerts before costs exceed your expectations.
Even simple notifications at 50%, 75%, and 90% of your monthly budget can help teams respond before spending gets out of control.
Turn Billing Insights into Action
The dashboard tells you what happened.
The next step is deciding what to do.
Some common optimization opportunities include:
- Rightsizing oversized virtual machines
- Deleting idle disks and snapshots
- Removing unused IP addresses
- Scheduling non-production workloads
- Using committed use discounts where appropriate
- Reviewing storage lifecycle policies
Small improvements across multiple resources often produce meaningful savings over time.
Final Thoughts
Your Google Cloud billing dashboard isn't just a monthly invoice viewer—it's a decision-making tool.
The more familiar you become with its reports, filters, and cost breakdowns, the easier it becomes to understand where your cloud budget is going and where you can optimize.
Instead of waiting for a surprisingly large bill at the end of the month, make it a habit to review your dashboard regularly. A few minutes each week can help you spot waste early, improve cost visibility, and build better cloud spending habits over time.