
 Sign up with Google
 Sign in with Zoho
.webp)

Introduction to Supply and Demand Graphs
Let’s be honest economics can sometimes feel like a maze of theories, numbers, and confusing terminology. But what if you could see how markets actually work instead of just reading about them? That’s exactly where a supply and demand graph maker comes in.
At its core, a supply and demand graph is a visual representation of how buyers and sellers interact in a market. It shows how prices are determined and how equilibrium is reached. But drawing these graphs manually? That can be time-consuming and frustrating.
A supply and demand graph maker simplifies the process. It transforms raw data into clear, professional-looking charts in seconds. Whether you’re a student trying to understand economics or a professional analyzing market trends, this tool makes your life easier.
What Is a Supply and Demand Graph
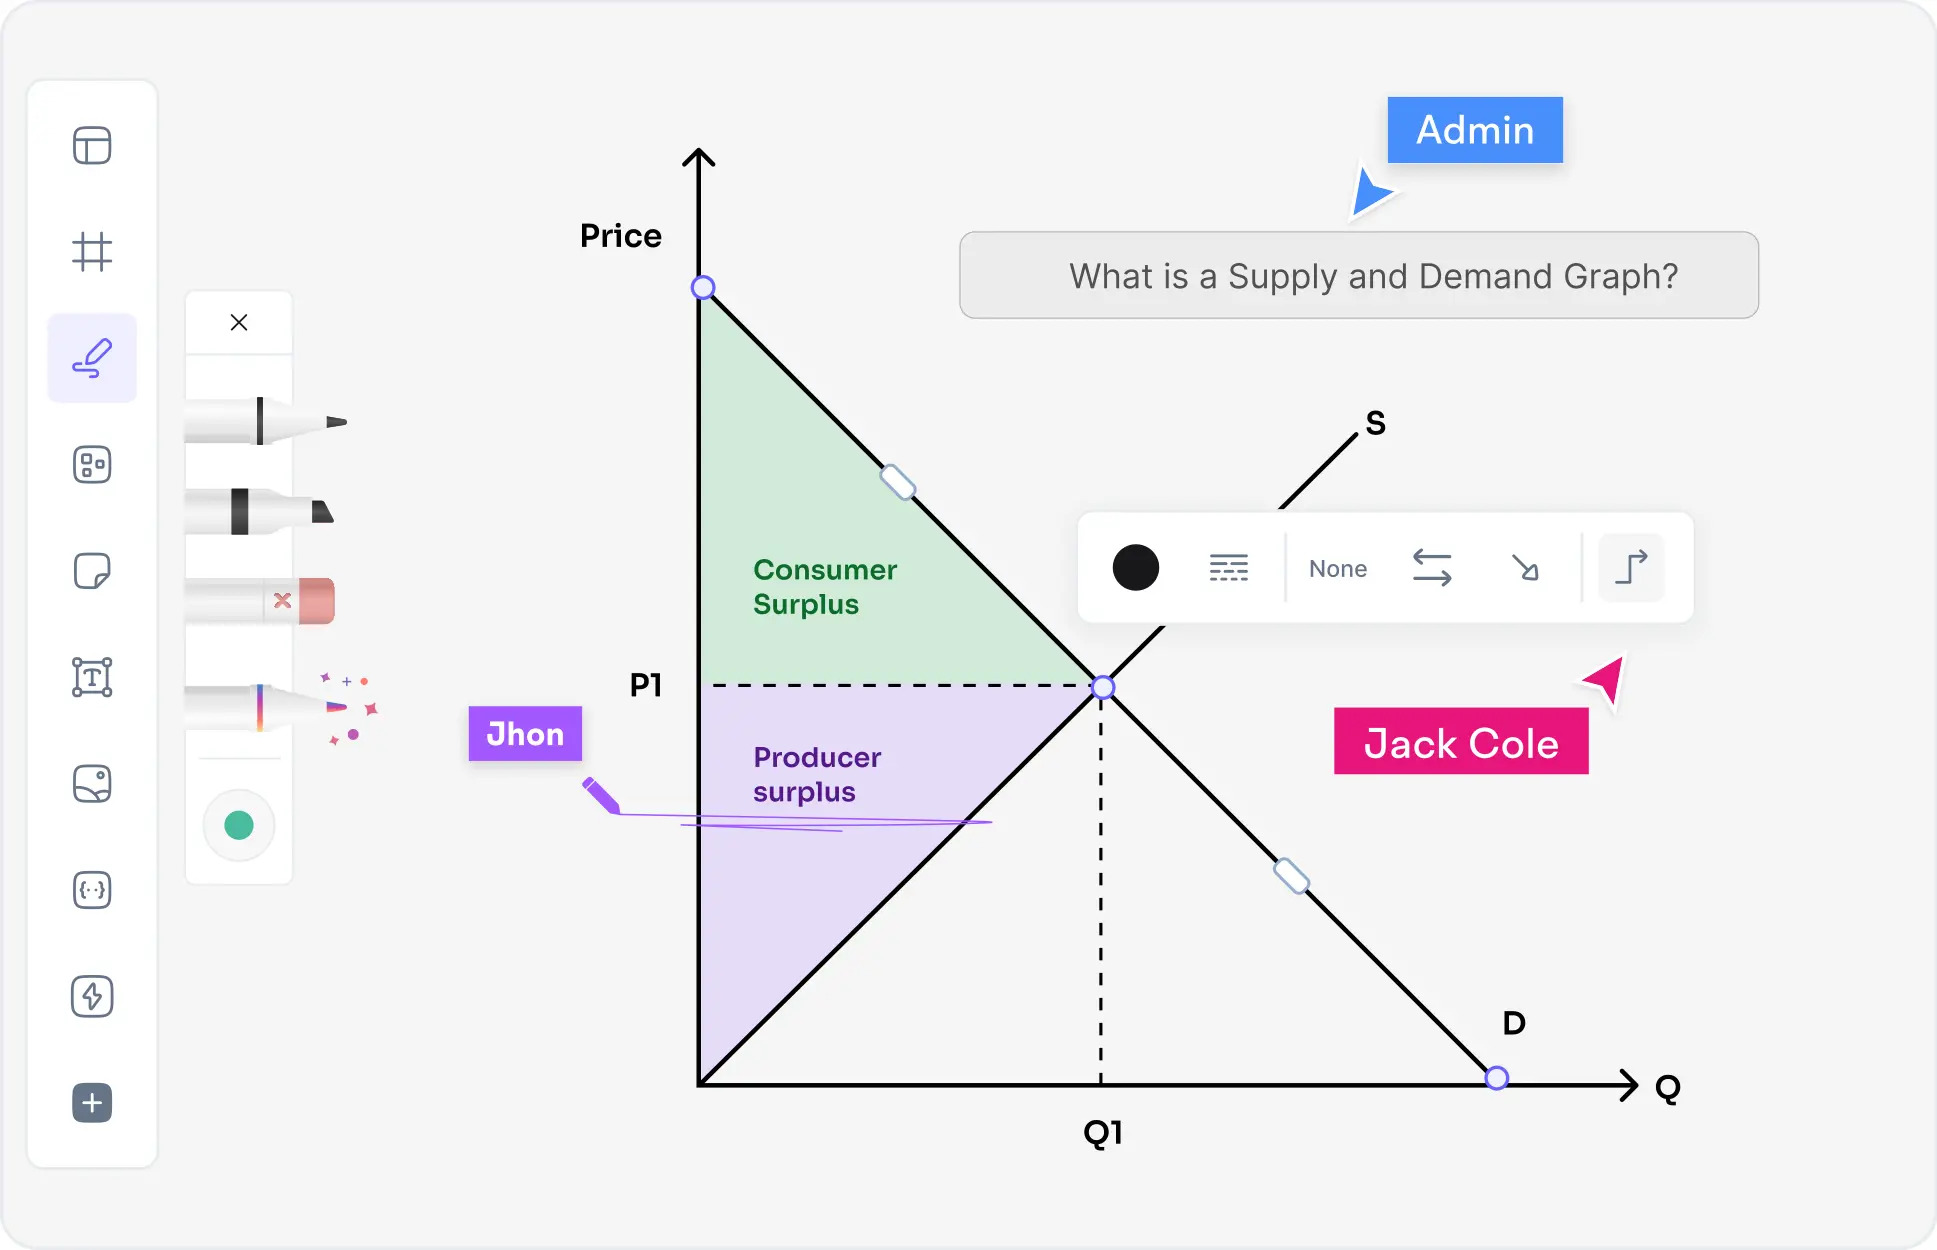
A supply and demand graph is a chart that illustrates the relationship between the price of a product and the quantity supplied or demanded.
On one side, you have the demand curve, which shows how much consumers are willing to buy at different prices. On the other side, you have the supply curve, which represents how much producers are willing to sell.
Key Components of a Supply and Demand Graph
Demand Curve
The demand curve slopes downward. Why? Because as prices decrease, consumers are willing to buy more.
Supply Curve
The supply curve slopes upward. As prices increase, producers are willing to supply more.
Equilibrium Point
At this point, the quantity supplied equals the quantity demanded. No shortages. No surpluses.
How a Supply and Demand Graph Maker Works
Input Data or Values
You start by entering data points-price levels and corresponding quantities.
Some tools even allow you to input formulas or datasets.
Automatic Curve Generation
Once the data is entered, the tool generates the supply and demand curves automatically.
No guesswork. No errors.
Customizing the Graph
Want to change colors? Add labels? Highlight equilibrium?
Most tools allow full customization so your graph looks exactly how you want.
Benefits of Using a Supply and Demand Graph Maker
Saves Time and Effort
Manually drawing graphs can take a long time.
With a graph maker, it takes seconds.
Improves Learning and Understanding
Visual learning is powerful.
Seeing curves and intersections makes economic concepts much easier to understand.
Enhances Presentations
A clean, professional graph can make your presentation stand out.
It communicates your message clearly and effectively.
Conclusion
A supply and demand graph maker is more than just a tool-it’s a bridge between complex economic theory and simple visual understanding. It transforms raw numbers into meaningful insights, helping students learn faster and professionals make smarter decisions.
In a world driven by data, the ability to visualize information clearly is a powerful advantage. And with the help of modern graph makers, anyone can create accurate, professional charts in just a few clicks.
So the next time you think economics is complicated, remember-sometimes all you need is the right visual.
FAQs
1 What is a supply and demand graph maker used for?
It is used to create visual graphs that show the relationship between supply and demand in a market.
2 Can beginners use a supply and demand graph maker?
Yes, most tools are user-friendly and designed for beginners as well as professionals.
3 Why is equilibrium important in these graphs?
Equilibrium shows the point where supply equals demand, which determines the market price.
4 Are these tools useful for business analysis?
Absolutely, businesses use them to analyze pricing, demand trends, and market behavior.
5 Can AI generate supply and demand graphs automatically? Yes, many modern tools use AI to create graphs and provide insights based on data.